Outline the relationship between a physical asset and its virtual model using our Industry Digital Twin PowerPoint Template. The concept of an industry twin is to create a digital twin, or copy, of the actual system for testing, optimization, and updates without interfering with real operations. This is especially important on larger scales, where it is not feasible to make continuous improvements or real-time changes. Real-time changes would cost much more time and require more output management. It involves IoT sensors, data analytics, and AI to construct the dynamic virtual representation of a physical asset, process, or system. Smart manufacturing consultants can use this template in client presentations to demonstrate the advantages of using digital twins for anomaly detection.
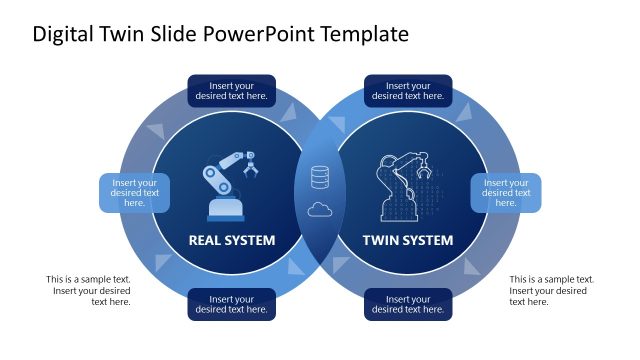
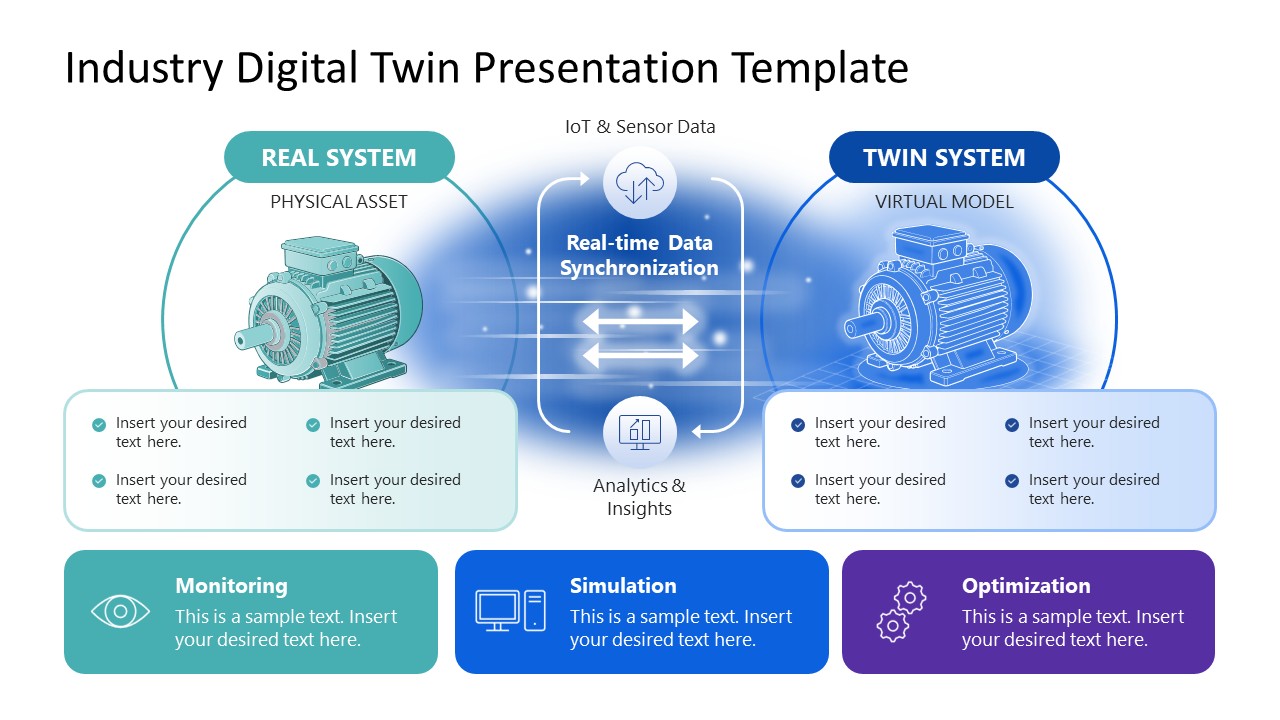
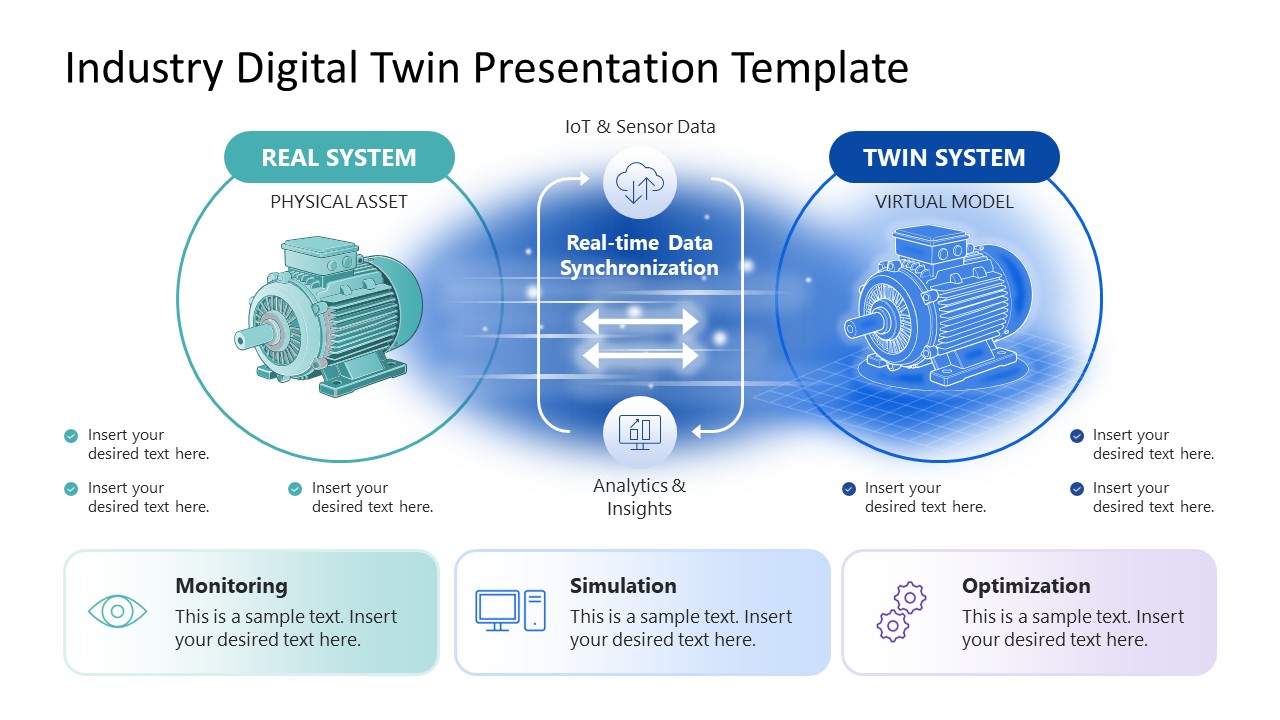
The Industry Digital Twin PowerPoint Template is a diagram slide showing two industrial twin systems (large motor units) running simultaneously. Professionals can show the real system on the left and the digital or twin system on the right, each in a circular shape. They can edit the placeholder text sections to display the key characteristics of each. Data analysts and IT experts can use this PPT template in their client presentations to highlight the IoT sensors and data structures that will be used to build the twin system. It shows a blurry background between the shapes, illustrating a deep connection between the two systems. IT engineers can visualize how the data flows and synchronize in real time throughout the process in their corporate training presentations. At the bottom of the diagram, three text segments allow research engineers to mention the details about:
- Monitoring
- Simulation
- Optimization
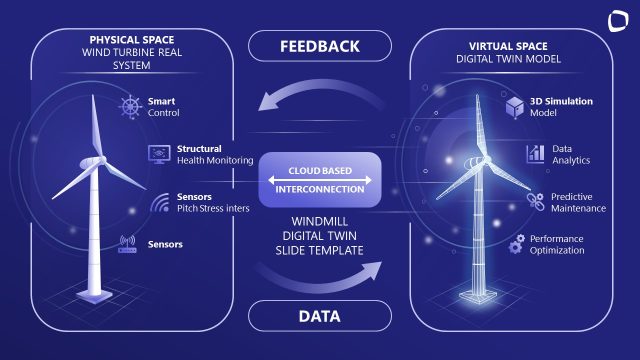
Download the industrial twin PPT template for your executive presentation and showcase the relationship between the physical object and its virtual model. Also, we have another version of the digital twin diagram template for your twin concept presentation.
What’s inside this template
Example presentation scenarios
- A smart manufacturing consultant can use the real system versus twin system diagram to explain digital twin value to an executive client audience.
- An IT engineer can present IoT sensor data flow by pointing to the central real-time data synchronization panel and analytics icon.
- A data analyst can describe operational outcomes by replacing the monitoring, simulation, and optimization card text with project-specific insights.
- An industrial training presenter can use the paired motor illustrations and bidirectional arrows to teach how a virtual model mirrors a physical asset.
Features
- 100% editable presentation template
- Compatible with Microsoft PowerPoint
- 16:9 aspect ratio slides
- Scalable vector shapes, icons and illustrations
- AI-Ready for Microsoft Copilot and Claude
- Instant access and download
Frequently asked questions
Q: How should a presenter explain the digital twin concept with this template?
A: Start with the left side as the physical asset, then move to the right side as the virtual model. Use the central synchronization panel to explain how IoT and sensor data keep both systems aligned. Close with the three bottom cards to translate the concept into monitoring, simulation, and optimization outcomes.
Q: Who is this digital twin diagram best suited for?
A: This template fits presenters who need to explain a technical architecture without showing a dense system map. Manufacturing consultants, IT engineers, data analysts, and operations leaders can use the paired motor systems, data synchronization arrows, and outcome cards to discuss digital twin adoption with executive or engineering audiences.
Q: Why does the layout use two circular systems and a blurred connection zone?
A: The two circles create a clear physical versus virtual comparison, while the center zone acts as the data bridge between them. That visual metaphor helps the audience see the twin as a synchronized counterpart, not a separate database. The bottom cards then ground the abstract relationship in practical industrial actions.
Industry Digital Twin PowerPoint Template
2-slide Microsoft PowerPoint presentation template for digital twin systems, synchronization, and industrial monitoring
The Industry Digital Twin PowerPoint Template is a 2-slide Microsoft PowerPoint diagram template for explaining the link between a physical asset and its virtual model. It includes a real system versus twin system comparison, a real-time data synchronization hub, and monitoring, simulation, and optimization cards for industrial technology presenters.
- Category
- Process Diagrams
- Rating

 Loading...
- Aspect ratio
- 16:9
- Item ID
- 23579-01
- Colors
 Microsoft PowerPoint
  Microsoft Copilot
  Claude for PowerPoint
 Other formats supported
Subscribe today and get immediate
access to download our PowerPoint templates.