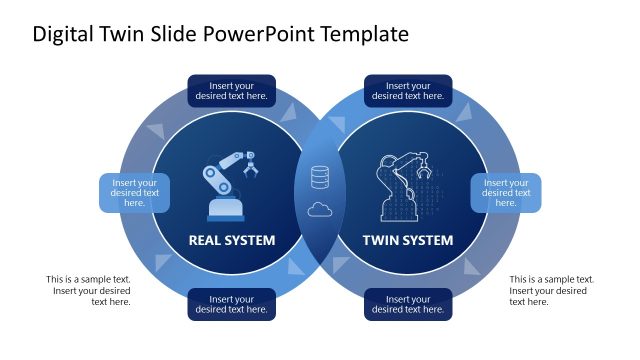
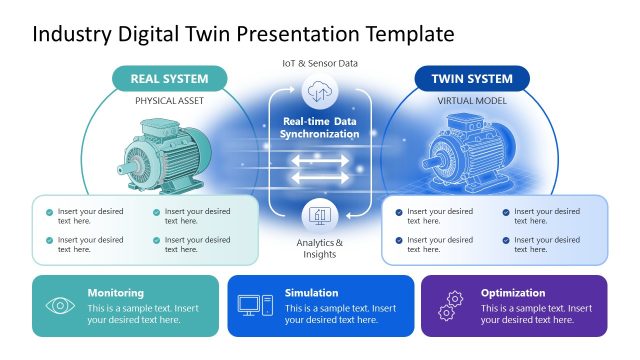
Visualizing the synchronization between physical assets and their virtual counterparts is a key aspect of modern industrial and technical reporting. This Digital Twin PowerPoint Template provides a sophisticated, data-centric layout to illustrate how real-world systems interact with their digital replicas. By mapping the bidirectional flow of information through a central cloud-based hub, this PPT slide helps stakeholders understand the value of predictive maintenance, real-time monitoring, and system optimization.
The design is built to support various technical use cases where accuracy and data flow are the priority:
- Real-Time Data Mirroring: Demonstrate how IoT sensors and smart controls capture physical behavior and translate it into a high-fidelity virtual model.
- Predictive Maintenance: Use the “Virtual Space” to visualize potential failure points and maintenance schedules based on real-world structural health data.
- Systems Integration: Highlight the critical role of cloud-based interconnection in maintaining a continuous feedback loop between environments.
- Operational Deep-Dives: Use the specialized infographic nodes to list specific variables like pitch stress, data analytics modules, and performance metrics.
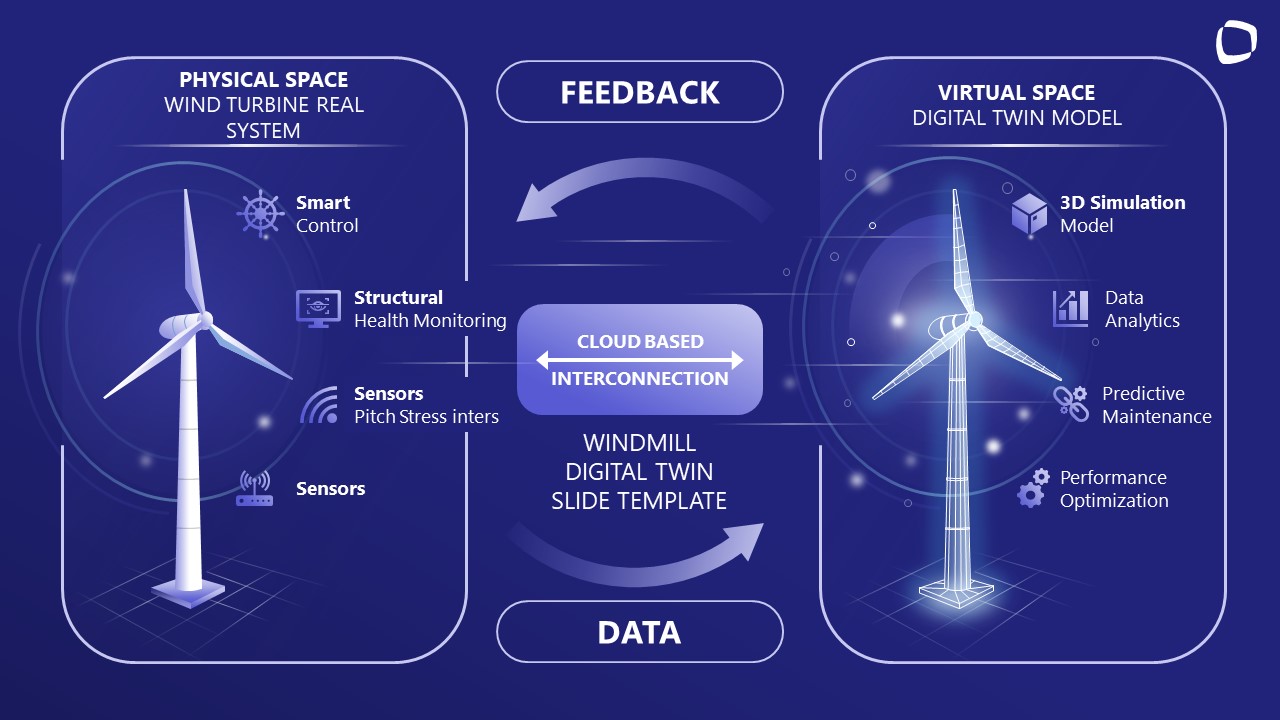
The slide layout uses a high-contrast bimodal design to create a clear separation between physical and virtual spaces. On one side, the asset is shown in its solid, mechanical state, while the opposite side displays a wireframe-inspired simulation to represent the digital twin. This visual distinction creates a natural information hierarchy, making it easy for the audience to follow the flow from raw data to actionable insights.
This presentation template is constructed with a focus on professional clarity and ease of use. Every element is a high-quality vector shape, ensuring that the intricate lines and icons remain sharp on high-definition boardroom displays. It is fully compatible with Microsoft PowerPoint and Google Slides, allowing you to swap the blue color scheme, change icons, or update text to match your specific industry: whether it’s energy, manufacturing, or robotics. The 16:9 widescreen format ensures a modern, polished look that integrates seamlessly into any corporate deck.
Showcase your technological capabilities with a high-impact visual. Download this Digital Twin PPT Template to finalize your next real-time systems presentation.
What’s inside this template
Example presentation scenarios
- An energy operations manager can use the physical and virtual space diagram to explain how sensor data supports wind turbine monitoring and predictive maintenance.
- An industrial IoT consultant can present the central cloud-based interconnection block to show how real asset data flows into a digital twin model.
- A technical sales presenter can use the feedback and data loop to explain the business value of smart controls, data analytics, and performance optimization.
- An engineering leader can use the side-by-side turbine illustrations to align nontechnical stakeholders around the difference between the real system and its digital model.
Features
- 100% editable presentation template
- Compatible with Microsoft PowerPoint and Google Slides
- 16:9 aspect ratio slides
- Scalable vector shapes, icons and illustrations
- AI-Ready for Microsoft Copilot and Claude
- Instant access and download
Frequently asked questions
Q: How should a presenter walk through this digital twin diagram without overwhelming the audience?
A: Start on the left with the physical wind turbine and its smart control, structural health monitoring, and sensor labels. Move to the central cloud-based interconnection as the transfer point. Then explain the right-side virtual model, including 3D simulation, data analytics, predictive maintenance, and performance optimization. Close by using the curved arrows to reinforce the continuous feedback loop.
Q: Who is this template best suited for in a business or technical presentation?
A: This template fits presenters who need to explain industrial IoT or renewable energy monitoring to stakeholders who may not know digital twin architecture. Engineering managers, energy operators, technical consultants, and solution sellers can use the side-by-side physical and virtual spaces to make the system logic visible before discussing costs, maintenance, or outcomes.
Q: Why does the physical space and virtual space metaphor help communicate the message?
A: The split-screen metaphor turns an abstract digital twin into a clear comparison: the real turbine on one side and its simulated model on the other. The cloud interconnection block and circular arrows show that the two spaces are not separate diagrams, but a connected operating system where data and feedback keep the model aligned with the asset.
Windmill Digital Twin Slide PowerPoint Template
1-slide presentation template for windmill digital twin, cloud interconnection, and turbine data flow
The Windmill Digital Twin Slide PowerPoint Template is a 1-slide process diagram for explaining a wind turbine's physical system, virtual model, cloud interconnection hub, and feedback/data loop. It is designed for energy, engineering, and technical teams building reports in Microsoft PowerPoint or Google Slides.
- Category
- Process Diagrams
- Rating

 Loading...
- Aspect ratio
- 16:9
- Item ID
- 23581-01
- Colors
 Microsoft PowerPoint
  Microsoft Copilot
  Claude for PowerPoint
 Other formats supported
Subscribe today and get immediate
access to download our PowerPoint templates.