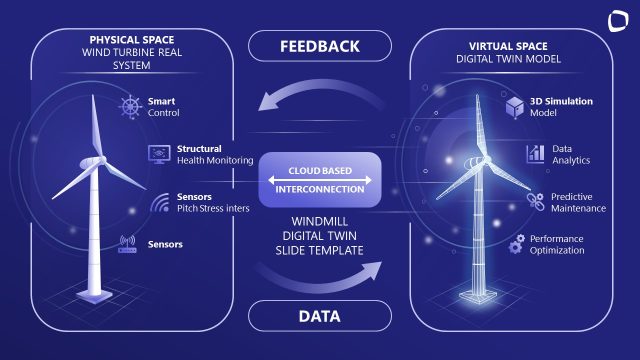
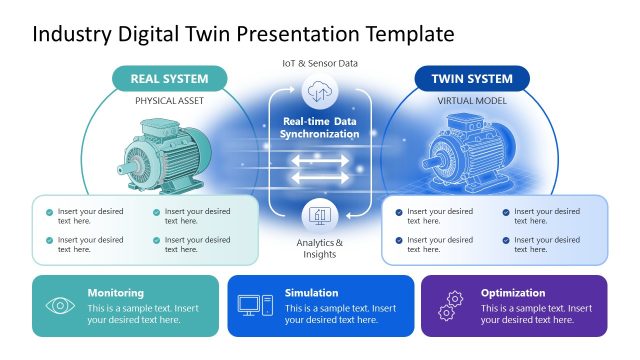
Visualizing the synchronization between physical assets and their virtual counterparts is essential for modern Industrial IoT (IIoT) and Industry 4.0 narratives. This Digital Twin Diagram PowerPoint Template offers a sophisticated, data-centric layout to illustrate how real-world objects, such as robotic arms, mechanical assemblies, or medical devices, interact with their digital replicas. By mapping out the bidirectional flow of information, this PPT template helps stakeholders understand the value of predictive maintenance, real-time monitoring, and virtual stress testing.
The slide layout is structured to facilitate deep-dives into Smart Manufacturing and Systems Engineering through several high-intent use cases:
- Real-Time Data Mirroring: Demonstrate how IoT sensors capture physical behavior and translate it into a high-fidelity virtual simulation.
- Predictive Maintenance Models: Use the “Twin System” to visualize potential failure points and maintenance schedules before they impact the “Real System.”
- Cloud & Database Integration: Highlight the critical role of cloud infrastructure and data storage in maintaining connectivity between the two environments.
- Operational Optimization: Show how simulation-driven insights can be fed back into physical production lines to increase efficiency and reduce downtime.
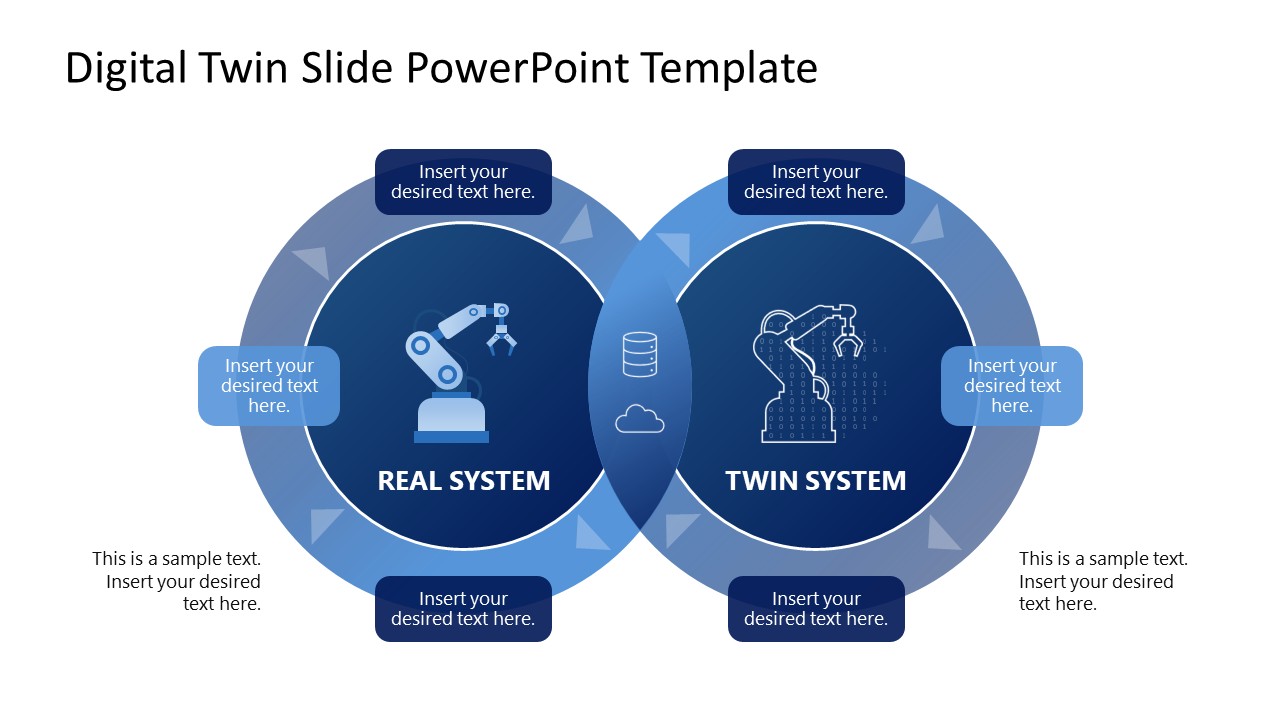
The design utilizes a Venn-style Interlocking Circular Geometry to signify the seamless convergence of the physical and digital worlds. Each “dial” represents a distinct state; the Real System features solid, mechanical iconography, while the Twin System is depicted with a digital, wireframe-inspired aesthetic. This visual contrast provides an immediate Information Hierarchy, allowing SaaS Architects or Automation Engineers to explain complex feedback loops without overwhelming the audience.
Every component of this template is a vector-based asset, ensuring zero resolution loss on high-definition boardroom screens. The central overlapping segment features dedicated icons for Cloud Computing and Database Management, serving as a logical anchor for the technical processes driving the simulation. Fully optimized for 16:9 widescreen in Microsoft PowerPoint and Google Slides, the deck also includes strategically placed text nodes for granular technical descriptions, making it the professional standard for presenting Cyber-Physical Systems.
Bridge the gap between physical reality and virtual insight. Download the Digital Twin Diagram PPT Template to prepare your next technological roadmap.
What’s inside this template
Example presentation scenarios
- An automation engineer can use the interlocking Real System and Twin System circles to explain how a machine and its digital model exchange information during an Industry 4.0 briefing.
- An IoT solution architect can use the central cloud and database overlap to show stakeholders where data storage and connectivity sit between physical sensors and a virtual simulation.
- A manufacturing manager can use the callout labels around the diagram to summarize predictive maintenance inputs, monitoring points, and feedback actions in an operations meeting.
- A technology consultant can use the robotic arm icons and supporting text areas to introduce the business value of digital twin adoption before moving into a detailed implementation plan.
Features
- 100% editable presentation template
- Compatible with Microsoft PowerPoint and Google Slides
- 16:9 aspect ratio slides
- AI-Ready for Microsoft Copilot and Claude
- Instant access and download
Frequently asked questions
Q: How should a presenter explain the digital twin concept with this single diagram?
A: Start with the left circle as the physical asset, then move to the right circle as the digital representation. Use the overlap to explain the shared data layer, such as cloud services or databases. Reserve the surrounding callouts for inputs, outputs, monitoring signals, and feedback actions so the audience sees one complete operating loop.
Q: Who is this template best suited for in a business or technical presentation?
A: This template fits presenters who need to explain a technical concept quickly to mixed stakeholders. Systems engineers, IoT architects, automation teams, and operations leaders can use it to connect shop-floor equipment, virtual simulation, and data infrastructure without opening with a dense network architecture or process map.
Q: Why does the interlocking circle design work for a digital twin message?
A: The two circles create a clear metaphor for the physical and digital worlds, while the overlap shows the shared information layer that makes the twin useful. The solid robotic arm on one side and wireframe-style arm on the other create contrast, helping viewers separate reality, model, and connection at a glance.
Digital Twin Diagram PowerPoint Template
1-slide presentation template for digital twin systems, circular diagram, and real-to-virtual data flow
This 1-slide Digital Twin Diagram PowerPoint Template shows the relationship between a real system and a twin system. The slide uses an interlocking circular diagram, central cloud and database overlap, robotic arm icons, and surrounding text callouts for engineers, architects, and managers presenting cyber-physical systems in PowerPoint or Google Slides.
- Category
- Diagrams
- Rating

 Loading...
- Aspect ratio
- 16:9
- Item ID
- 23578-01
- Colors
 Microsoft PowerPoint
  Microsoft Copilot
  Claude for PowerPoint
 Other formats supported
Subscribe today and get immediate
access to download our PowerPoint templates.