Gartner Hype Cycle Curve Template for PowerPoint
Download the Gartner Hype Cycle Curve Template for PowerPoint. Easily create a custom hype cycle to graphically represent the life cycle stages of technology and products in the market.
This diagram template is easy to edit, and you can create your very own Gartner Hype Cycle Curve. Whether you are an IT professional, consultant, business professional, or a student looking to construct hype cycle stages for analytical reasons, this template can save you work hours by making your task quite easy.
The Hype Cycle curve slide template can be used as a strategic technology tool to understand and present emerging technologies’ life cycle stages in a business context. The Gartner hype cycle template is compatible with PowerPoint and Google Slides presentations.
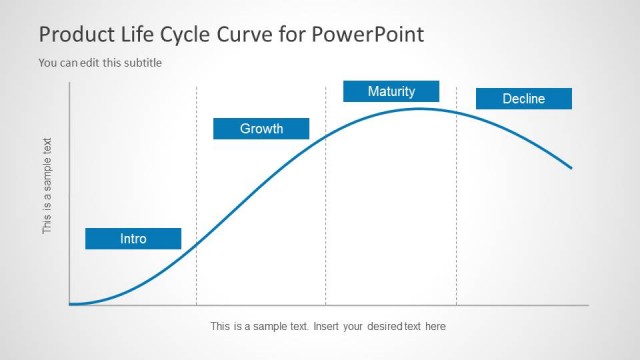
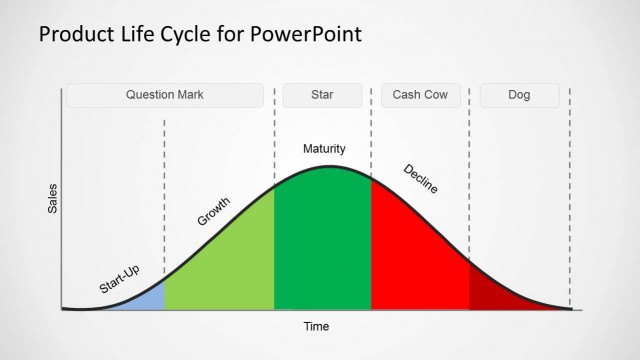
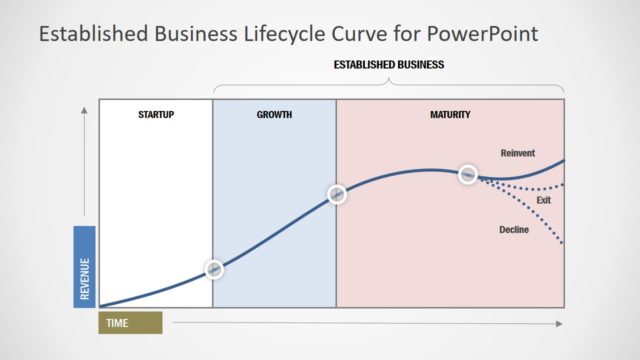
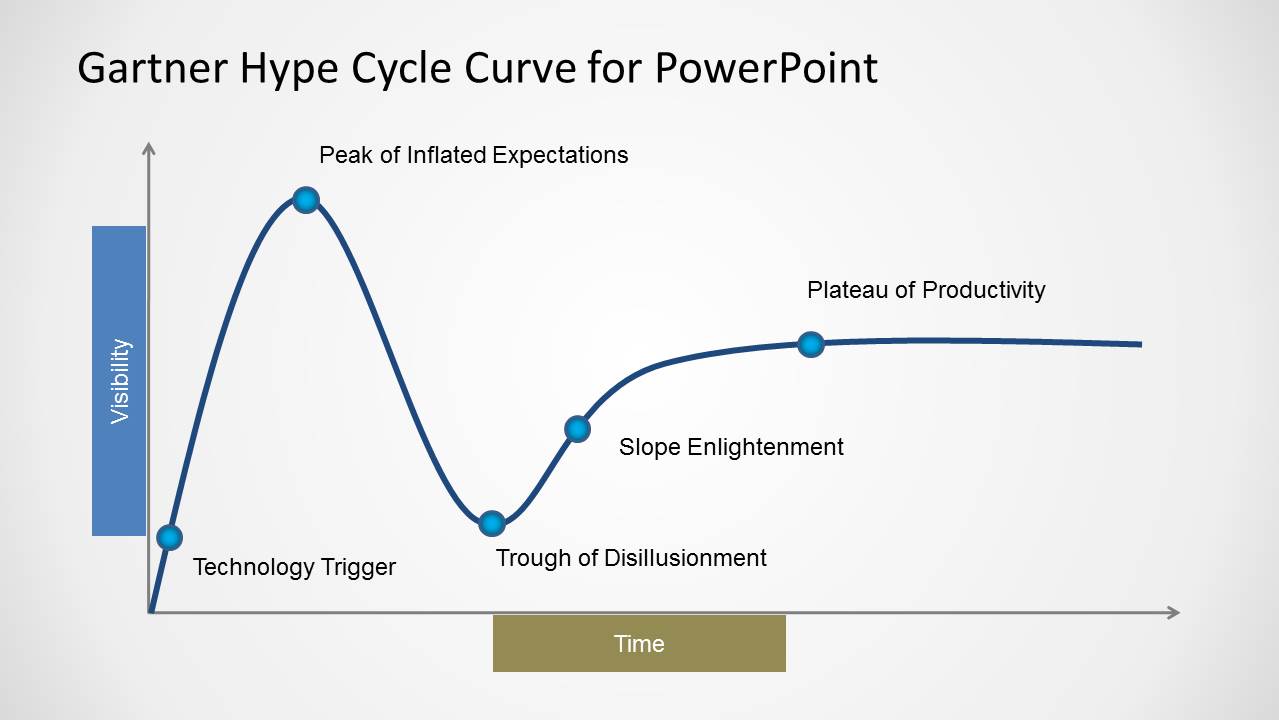
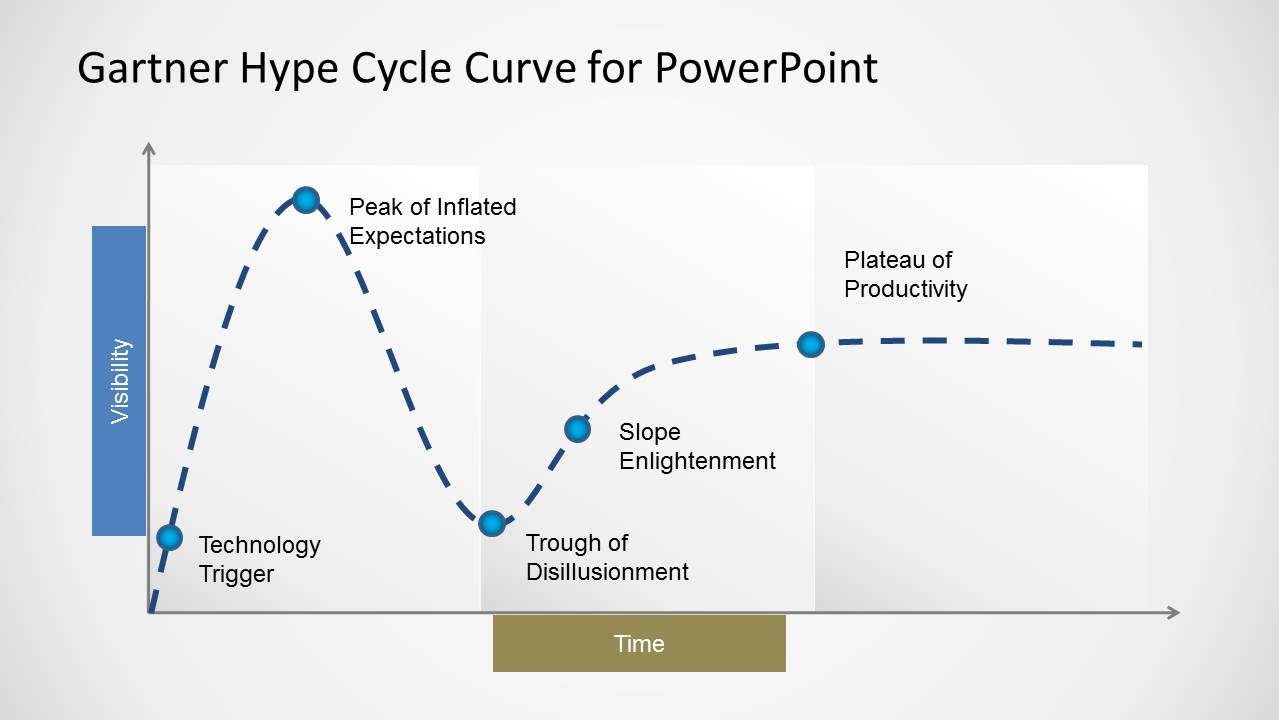
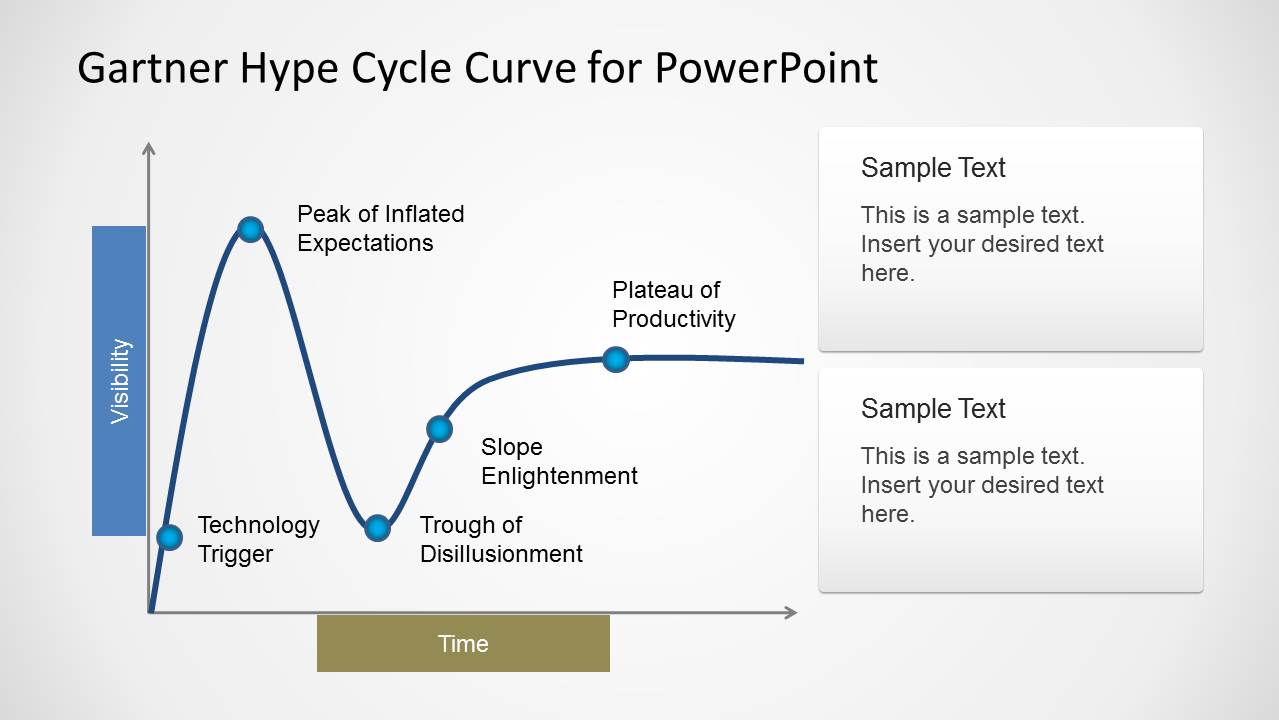
The Hype Cycle Curve can help to understand the progression of a technology from its inception to mainstream adoption. It highlights key phases like the Innovation Trigger, Peak of Inflated Expectations, Trough of Disillusionment, Slope of Enlightenment, and Plateau of Productivity.
As a Strategic Business tool, the Hype curve slide template for PowerPoint & Google Slides can be used to analyze and discuss where a technology stands in its lifecycle of a product. It’s great for strategic planning, investment decisions, market analysis, and understanding technology maturity.


You must be logged in to download this file.
DOWNLOAD- Category
- Curves & Lines
- Rating


 Loading...
- Size
- 16x9
- Item ID
- 6367-01
- Colors
Subscribe today and get immediate
access to download our PowerPoint templates.