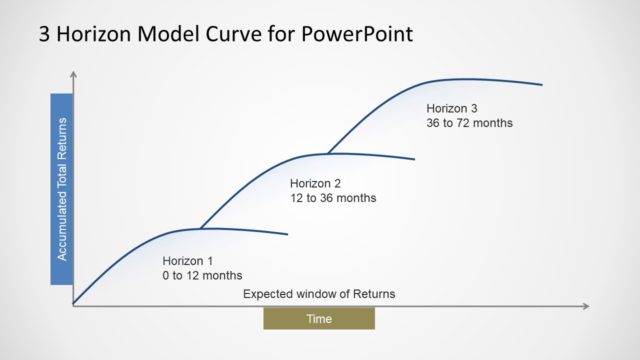
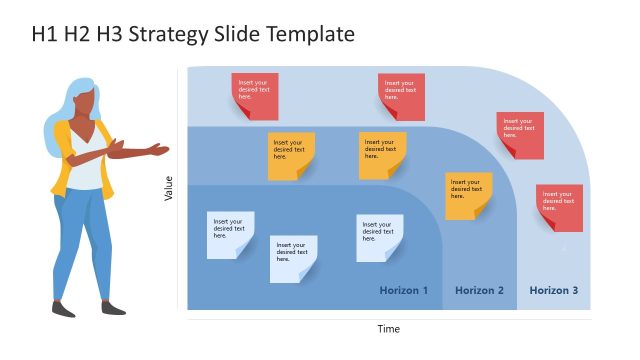
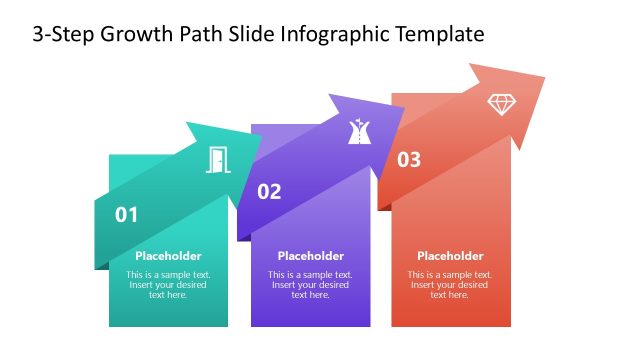
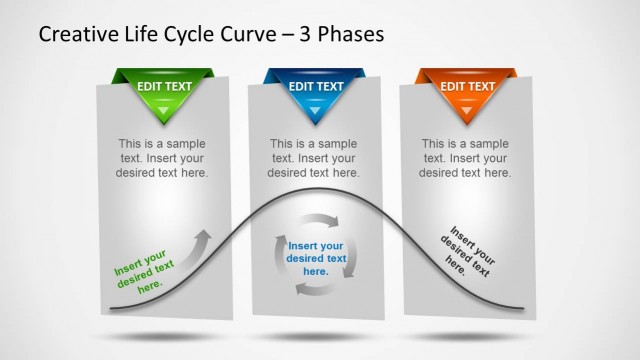
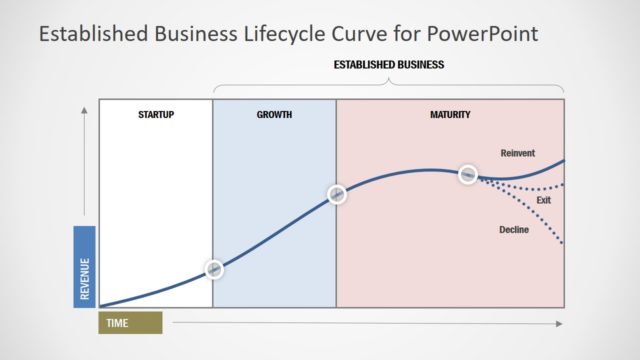
Three Horizons Model Curve for PowerPoint is a presentation design template for Microsoft PowerPoint containing the widespread three horizons curve design.
The three horizons model helps to describe and understand the different phases in a company’s growth process. As companies mature, they often face declining growth as innovation gives way to inertia. The three horizons model provides a structure for companies to assess potential opportunities for growth without neglecting performance in the current stage (present).
In the three-horizon model, each horizon represents those core businesses most readily identified with the company name and those that provide the most significant profits and cash flow. The three horizons framework helps companies to understand sustained growth and illustrate how to manage the current performance while maximizing future opportunities for growth.
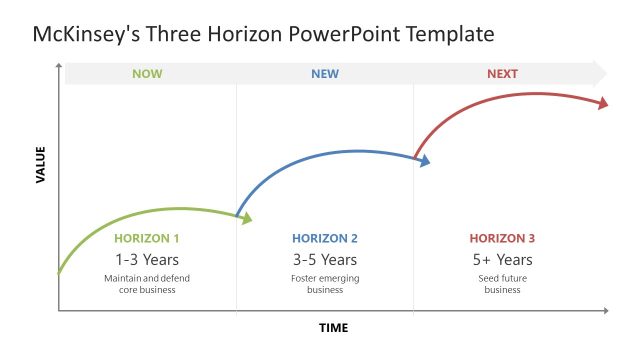
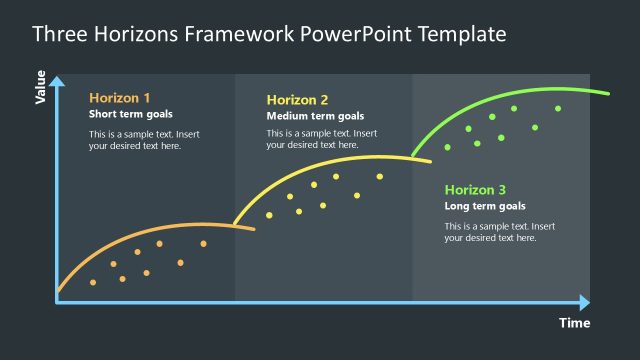
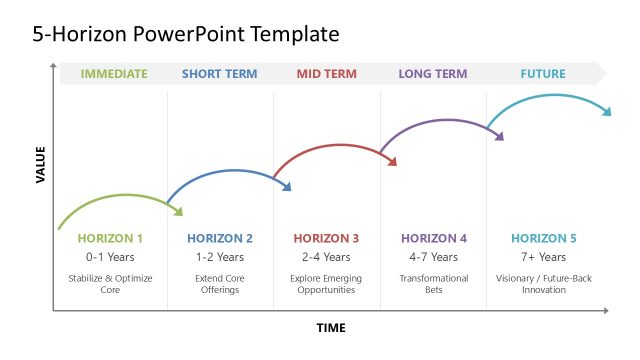
This three horizon model curve for PowerPoint presentations can be used as a growth template for PowerPoint to describe the three-horizons framework or the growth phases in a company presentation. Alternatively, you can download other Three Horizons PPT templates, including the McKinsey PowerPoint templates for presentations in PowerPoint or Google Slides.
What’s inside this template
Example presentation scenarios
- A corporate strategy director can use the base Three Horizons curve to brief executives on how near-term revenue, emerging growth, and future options relate across time.
- An innovation manager can use the current business callout slide to show why existing cash flow must be protected while new opportunities are evaluated.
- A management consultant can use the high-growth business callout to explain where mid-term initiatives should begin contributing revenue and future cash flow.
- A business development leader can use the growth options slide to frame long-term bets, experiments, and portfolio choices for senior stakeholders.
Features
- 100% editable presentation template
- Compatible with Microsoft PowerPoint and Google Slides
- 16:9 aspect ratio slides
- Scalable vector shapes, icons and illustrations
- AI-Ready for Microsoft Copilot and Claude
- Instant access and download
Frequently asked questions
Q: How should a presenter explain the three horizons without making it feel like a generic growth chart?
A: Start with Slide 1 to define the axes and time horizons before discussing any recommendations. Then move through the callout slides in order: current business, high-growth business, and growth options. This sequence helps the audience see that the model is not only about future ideas, but about balancing today's returns with tomorrow's portfolio.
Q: Who is this Three Horizons template best suited for?
A: This template fits strategy leaders, innovation managers, and consultants who need a concise visual for portfolio conversations. It is strongest when the decision involves tradeoffs between protecting current cash flow and funding new growth. The labeled curve and horizon callouts help executive audiences compare timing, maturity, and expected returns quickly.
Q: Why does the overlapping curve metaphor help communicate business growth strategy?
A: The overlapping curves show that horizons do not start and end as isolated projects. Current performance, emerging businesses, and future options coexist, compete for attention, and mature at different rates. The red, blue, and green emphasis areas guide the eye across time while keeping the full growth system visible.


Three Horizons Model Curve for PowerPoint
4-slide presentation template for Three Horizons growth curves, phase horizons, and return windows
Three Horizons Model Curve for PowerPoint is a 4-slide presentation template for explaining staged business growth. It includes a three-horizon curve diagram, labeled return axes, time horizon headers, and annotated callout slides for current business, high-growth business, and growth options in Microsoft PowerPoint and Google Slides.
- Category
- Curves & Lines
- Rating


 Loading...
- Aspect ratio
- 16:9, 4:3
- Item ID
- 6227-03
- Colors
 Microsoft PowerPoint
 Microsoft Copilot
 Claude for PowerPoint
Other formats supported
Subscribe today and get immediate
access to download our PowerPoint templates.