Creative Life Cycle Curve with 3 Phases for PowerPoint– Life cycle is an organizational model and theory that highlight on the birth, growth and death of an organization by Mason Haire. The creative feel in the layout draw professional audiences to attention. It is minimalistic and functional. The effective visuals aid both the presenter and audience to meet in between. Thus, it generates a quality experience.
There are five phases and five stages in an organizational life cycle. The stages are cyclical and can be a repeating occurrence, as follows:
Stage 1 – Existence
Stage 2 – Survival
Stage 3 – Maturity
Stage 4 – Renewal
Stage 5 – Decline
Phases, however, represent the difficulties or development of an organization through time. Each phase starts with an evolution (stability) and ends with a revolution (disturbance). Here are the 5 phases of organizational growth according to Lori Greiner:
Phase 1- Creative expansion to Leadership crisis
Phase 2- Directional expansion to Autonomy crisis
Phase 3- Expansion through delegation to Control crisis
Phase 4- Expansion through coordination to Red tape crisis
Phase 5- Expansion through collaboration
The PowerPoint template is ideal for organizational development presentations. It is perfect for project planning and company orientations. The slide can serve as a supplement to more general reports. It can be a dashboard while the user talks about the status of a company and the possible expansions it can undergo.
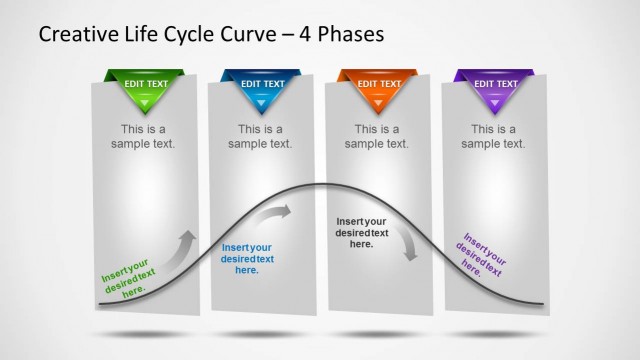
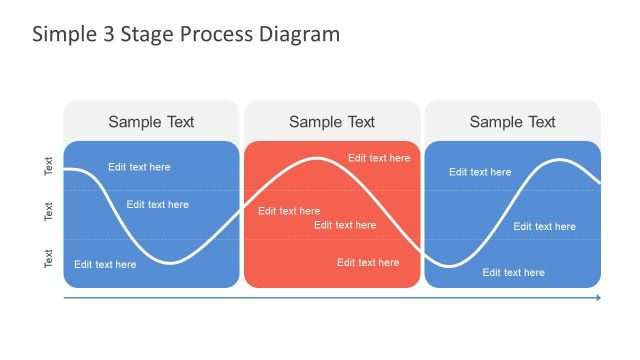
The slide design is composed of 3 white rectangular text placeholders. Each PowerPoint shape has a triangle, colored marker on top. The speaker can enter phase or stage titles in it. A curve is featured on the bottom of the objects. It can symbolize the growth, performance or journey of an organization. The flat parts can represent low periods while the peak can metaphor the most productive timeframes.
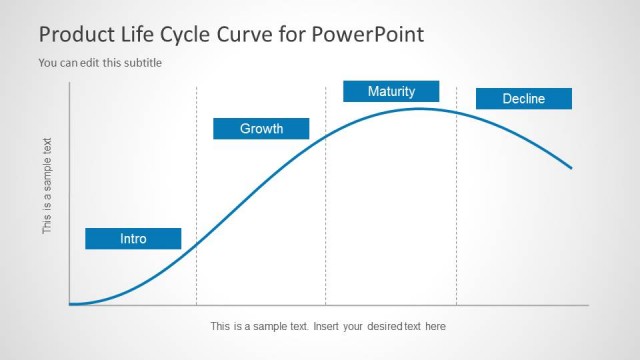
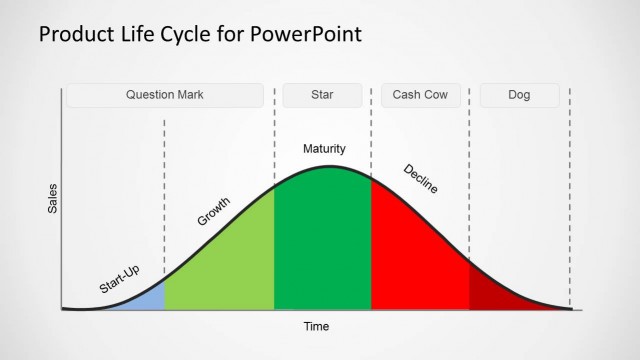
Creative Life Cycle Curve with 3 Phases for PowerPoint is a smart and strategic approach to any organizational presentation concept. Checkout Product Life Cycle Template for PowerPoint from the SlideModel gallery.
What’s inside this template
Example presentation scenarios
- A product manager can use the three phase cards to explain how a product moves from early adoption through growth and toward a later stage decision.
- A strategy consultant can use the S-curve path to show how organizational performance rises, peaks, and changes across three defined phases.
- A project lead can use the colored triangle headers and body text blocks to summarize a staged implementation plan for stakeholders.
- An organizational development presenter can use the circular arrow callout to discuss renewal, repetition, or feedback inside the middle phase of a lifecycle.
Features
- 100% editable presentation template
- Compatible with Microsoft PowerPoint and Google Slides
- 16:9 aspect ratio slides
- Scalable vector shapes, icons and illustrations
- AI-Ready for Microsoft Copilot and Claude
- Instant access and download
Frequently asked questions
Q: How should I present the three phases without making the slide feel crowded?
A: Use the triangle headers for short phase names and keep each vertical card to one main idea. Put interpretation, risk, or action notes along the curve only where the audience needs context. The design works best when the S-curve carries the story and the three cards provide concise evidence or definitions.
Q: Who is this life cycle curve best suited for?
A: This layout fits managers, consultants, product leads, and project teams who need to explain a transition in simple stages. It is especially useful when the audience must compare three phases side by side while still seeing one continuous lifecycle path, such as growth, maturity, and renewal.
Q: Why does the curved path work better than a straight timeline for this message?
A: The curve acts as a visual metaphor for changing momentum rather than a fixed schedule. Its rise and fall suggest acceleration, peak performance, and decline or redirection. That makes the diagram better for explaining life cycle behavior, organizational growth, or product movement than a flat linear timeline.


Creative Life Cycle Curve with 3 Phases for PowerPoint
1-slide presentation template for 3-phase life cycle curve and growth model diagrams
This 1-slide diagram template presents a 3-phase life cycle curve for organizational growth, product development, or project status discussions. The slide combines a three-column phase diagram, colored triangle headers, an S-curve journey line, and circular arrow callouts for PowerPoint and Google Slides.
- Category
- Diagrams
- Rating


 Loading...
- Aspect ratio
- 16:9
- Item ID
- 6185-06
- Colors
 Microsoft PowerPoint
 Microsoft Copilot
 Claude for PowerPoint
Other formats supported
Subscribe today and get immediate
access to download our PowerPoint templates.