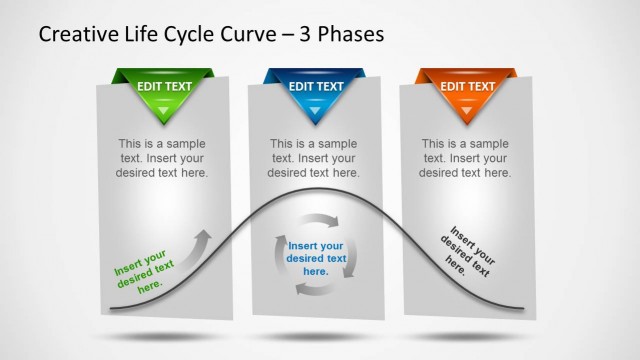
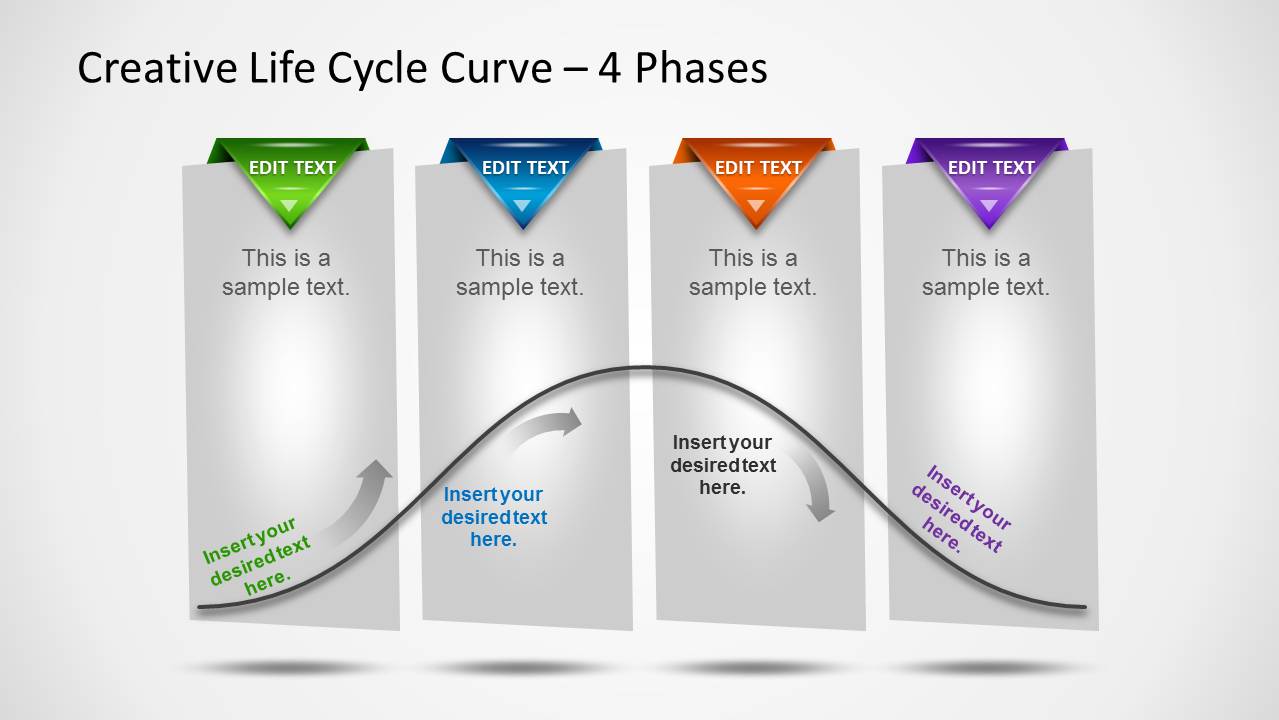
Create product lifecycle diagrams with elegant slide designs with the Creative Life Cycle Curve with 4 Phases for PowerPoint.
This PowerPoint Template contains a visually appealing product lifecycle slide designs to help you construct a professional looking product lifecycle for official or academic use.
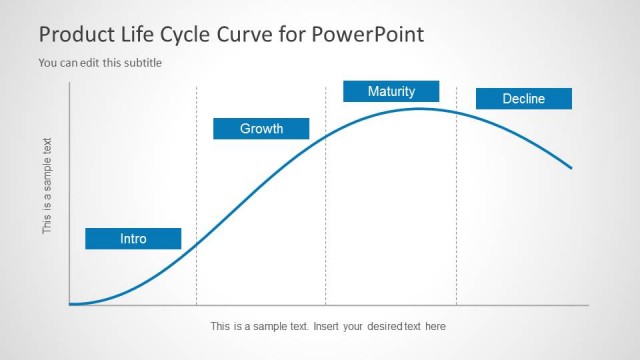
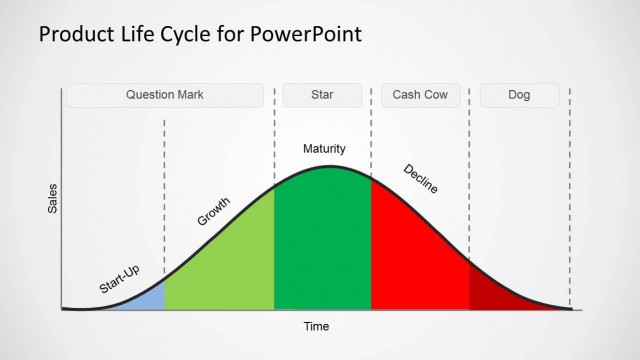
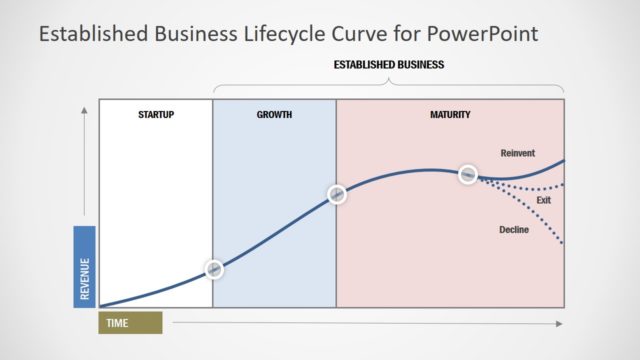
With this template you can not only construct sample product lifecycle diagrams for use in your school presentations or class lectures but even create a product lifecycle that depicts a timeline for the growth, maturity, saturation and decline for your own product.
What’s inside this template
Example presentation scenarios
- A product manager can use the four phase panels to explain how a product moves from launch traction to maturity and decline during a portfolio review.
- A marketing strategist can use the curved trajectory and text callouts to discuss demand growth, saturation, and campaign focus across product stages.
- A business consultant can use the ribbon-labeled columns to compare a client's current position against the next phase in a market maturity discussion.
- An instructor can use the single life cycle curve diagram to teach students how product growth, maturity, saturation, and decline relate over time.
Features
- 100% editable presentation template
- Compatible with Microsoft PowerPoint and Google Slides
- 16:9 aspect ratio slides
- Scalable vector shapes, icons and illustrations
- AI-Ready for Microsoft Copilot and Claude
- Instant access and download
Frequently asked questions
Q: How should a presenter explain the four-phase curve without overcrowding the slide?
A: Treat each vertical panel as one stage in the story and limit each text block to the main behavior, risk, or decision for that phase. Start at the left of the curve, pause at the peak, and finish with the decline section so the audience understands both progression and consequence.
Q: Who is this life cycle curve best suited for?
A: This diagram works best for product managers, marketers, consultants, and educators who need to explain stage movement rather than detailed financial data. It is strongest when the message is conceptual: where a product, service, campaign, or market sits in a four-phase maturity pattern.
Q: Why does the curved path communicate the life cycle better than four separate boxes?
A: The curve acts as the visual metaphor for rise, peak, and decline, while the four vertical panels keep the explanation segmented. This combination helps audiences see that each phase is distinct but connected, making the transition from growth to maturity and decline easier to follow.
Creative Life Cycle Curve with 4 Phases for PowerPoint
1-slide presentation template for product life cycle phases with curve diagram and ribbon markers
Creative Life Cycle Curve with 4 Phases for PowerPoint is a one-slide diagram template for explaining product life cycle movement across four stages. It shows four vertical phase panels, colored ribbon headers, a curved growth-to-decline path, and editable text callouts for business, marketing, or classroom presentations in Microsoft PowerPoint and Google Slides.
- Category
- Diagrams
- Rating


 Loading...
- Aspect ratio
- 16:9
- Item ID
- 6185-07
- Colors
 Microsoft PowerPoint
  Microsoft Copilot
  Claude for PowerPoint
 Other formats supported
Subscribe today and get immediate
access to download our PowerPoint templates.