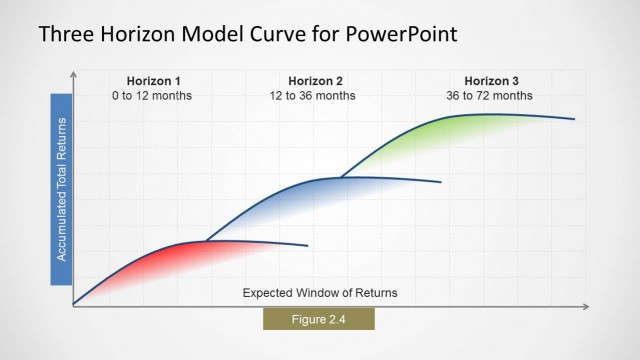
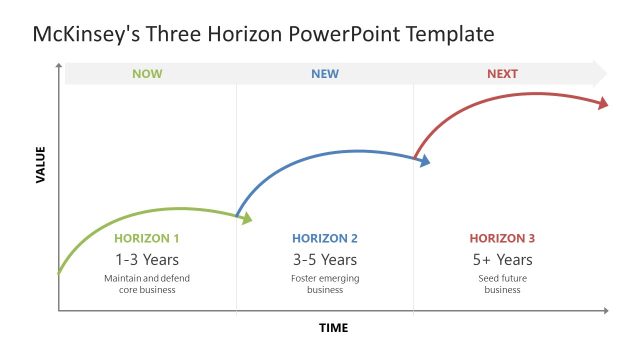
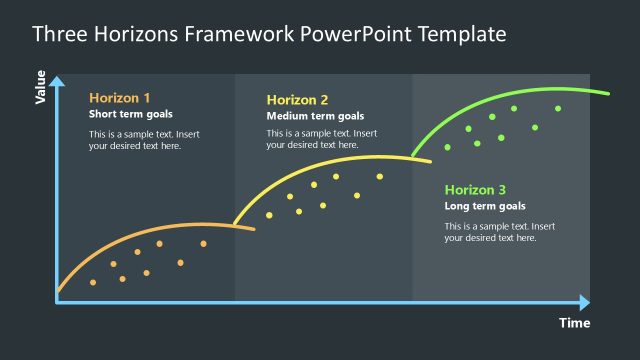
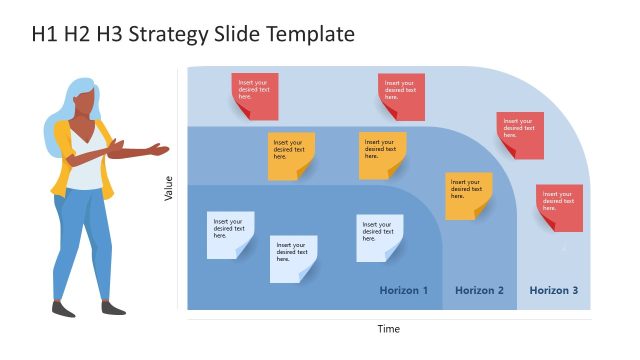
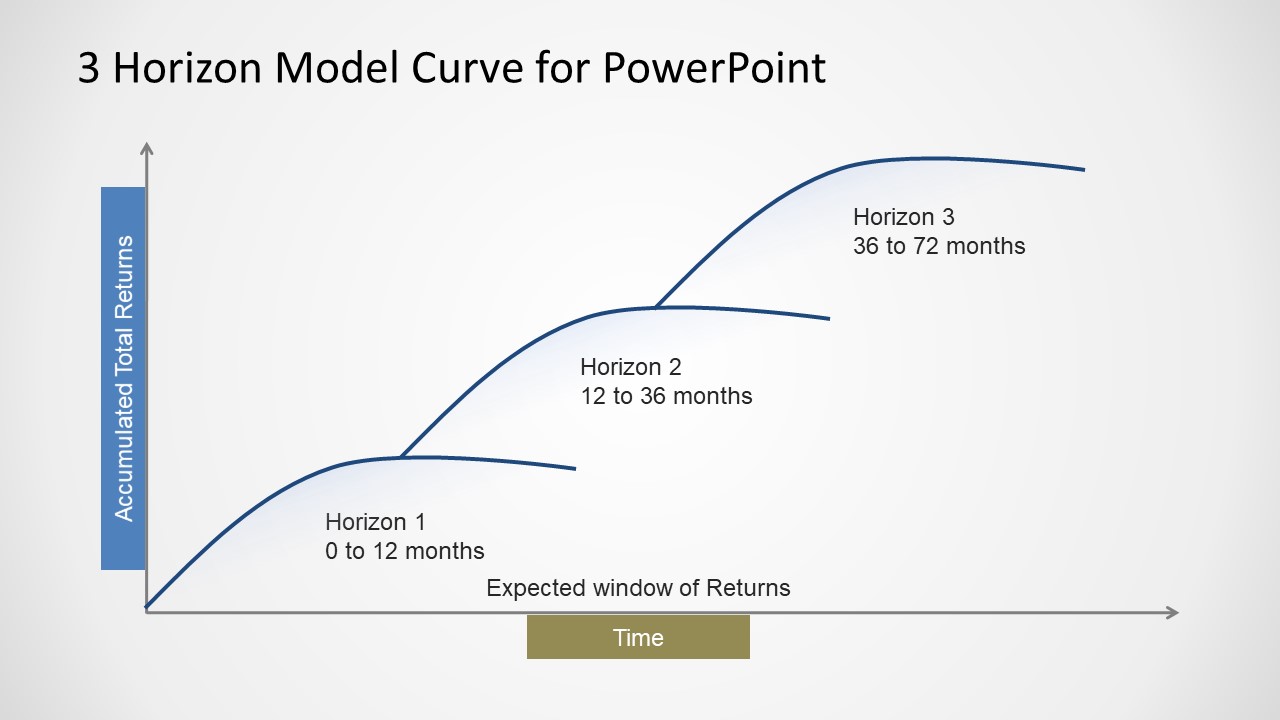
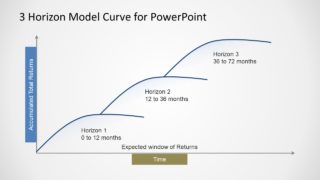
3 Horizon Model Curve design for PowerPoint is a presentation template you can download to prepare presentations on McKinsey’s 3 Horizons of Growth model. As companies mature, they often face declining growth as innovation gives way to inertia. Companies must attend to existing businesses while still considering areas they can grow in the future, so this helps achieve consistent growth throughout their corporate lifetimes.
This model is also known as the H1 H2 H3 strategy, and to successfully apply this McKinsey model, corporate innovators should come with a balanced innovation portfolio:
- H1: defend the core (sustaining innovation)
- H2: extending the business (disruptive innovation)
- H3: transformative innovation
Alternatively, you can download other growth model curves for PowerPoint or the 3 Horizons of Growth template with a color shading effect.
What’s inside this template
Example presentation scenarios
- A strategy consultant can use the base curve diagram to introduce the Three Horizons model before recommending how leadership should classify current, emerging, and future initiatives.
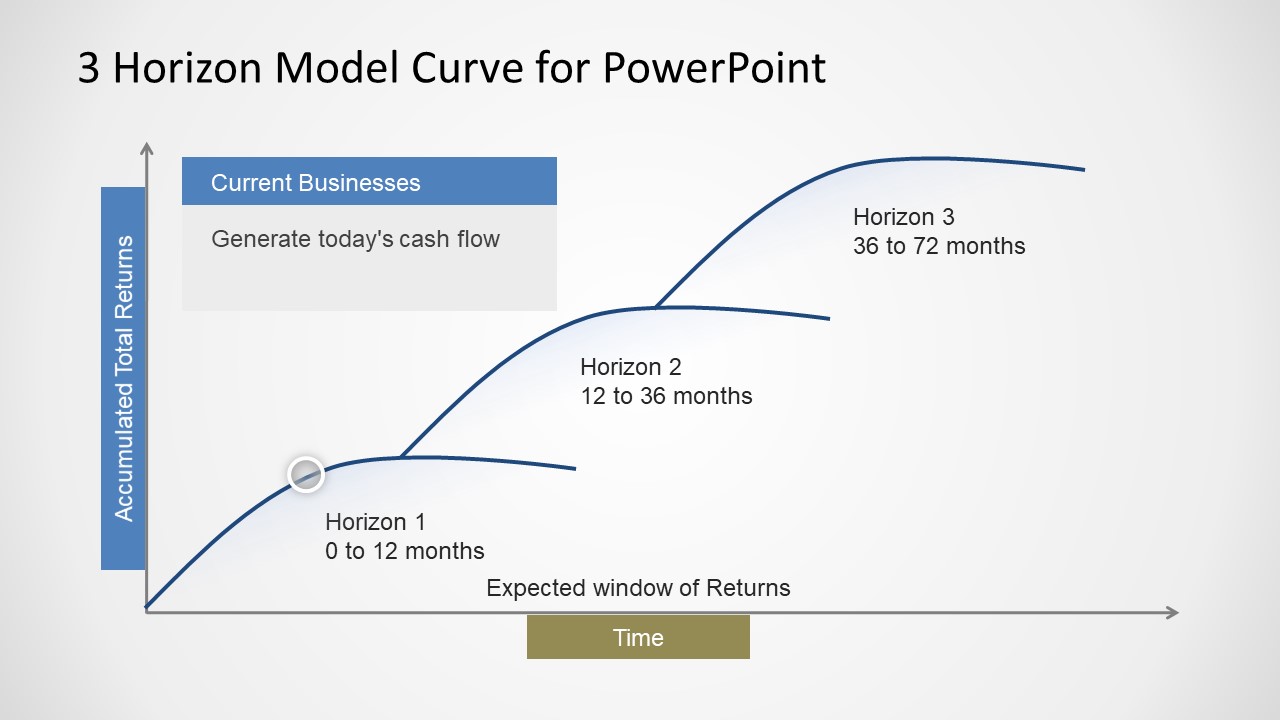
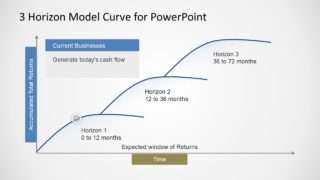
- An innovation leader can use the Current Businesses callout slide to show executives which core businesses generate near-term cash flow and require sustaining investment.
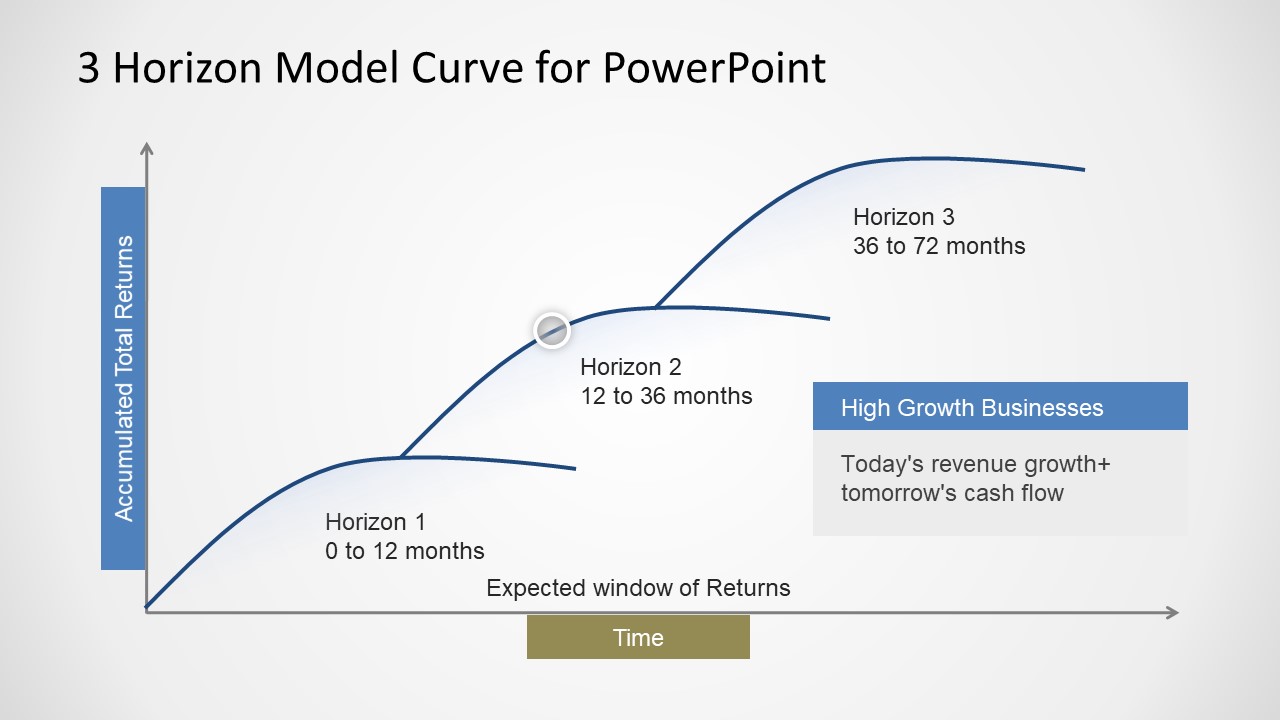
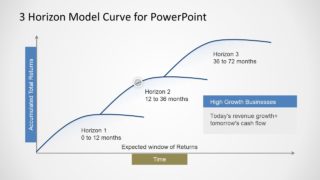
- A business unit manager can use the High Growth Businesses callout slide to discuss initiatives expected to produce both current revenue growth and tomorrow's cash flow.
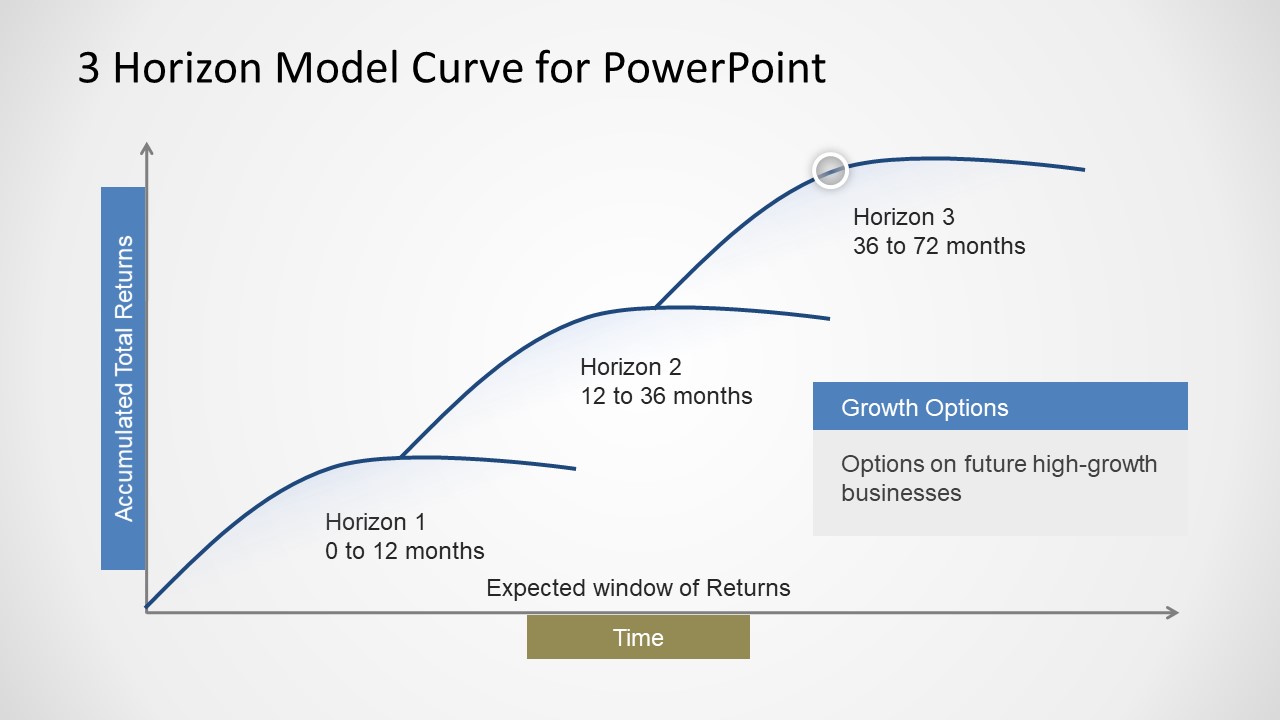
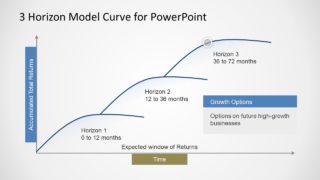
- A corporate planning team can use the Growth Options callout slide to frame long-term bets, experimental ventures, and future high-growth business opportunities.
Features
- 100% editable presentation template
- Compatible with Microsoft PowerPoint and Google Slides
- 16:9 aspect ratio slides
- Scalable vector shapes, icons and illustrations
- AI-Ready for Microsoft Copilot and Claude
- Instant access and download
Frequently asked questions
Q: How should a presenter explain the Three Horizons message with this curve diagram?
A: Start with Slide 1 to define the axes: accumulated total returns and time. Then move through the callout slides in order, tying Horizon 1 to current cash flow, Horizon 2 to emerging growth, and Horizon 3 to longer-term options. Keep each discussion tied to investment timing, not just to initiative names.
Q: Who is this template best suited for in a strategy meeting?
A: This template fits consultants, corporate strategy teams, and innovation leaders who need a simple way to explain portfolio balance. It is strongest when the audience must compare today's operating businesses with growth businesses and future options, especially in executive planning sessions where the conversation needs a shared mental model.
Q: Why does the repeated curve layout help communicate growth planning?
A: The repeated curve creates a consistent visual metaphor for growth maturity over time. Each slide keeps the same axes and horizon labels, then moves attention with a marker and callout. That design reduces relearning, so the audience can focus on how the business mix changes from core cash flow to future options.
3 Horizon Model Curve Template for PowerPoint
4-slide presentation template for Three Horizons growth planning with curve diagrams and horizon callouts
3 Horizon Model Curve Template for PowerPoint is a 4-slide strategy diagram deck for explaining McKinsey's Three Horizons of Growth. It includes a labeled return-over-time curve, horizon labels for 0 to 12, 12 to 36, and 36 to 72 months, plus callout versions for current businesses, high growth businesses, and growth options in PowerPoint and Google Slides.
- Category
- Curves & Lines
- Rating


 Loading...
- Aspect ratio
- 16:9
- Item ID
- 6227-01
- Colors
 Microsoft PowerPoint
  Microsoft Copilot
  Claude for PowerPoint
 Other formats supported
Subscribe today and get immediate
access to download our PowerPoint templates.