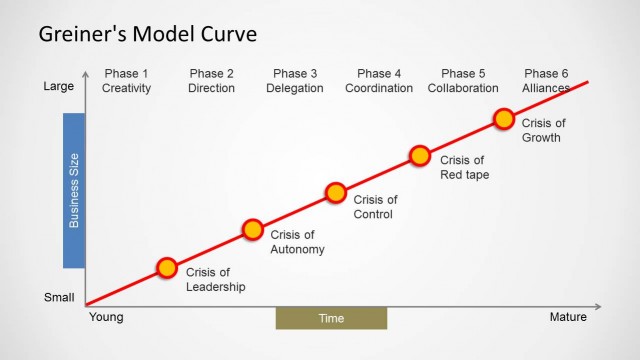
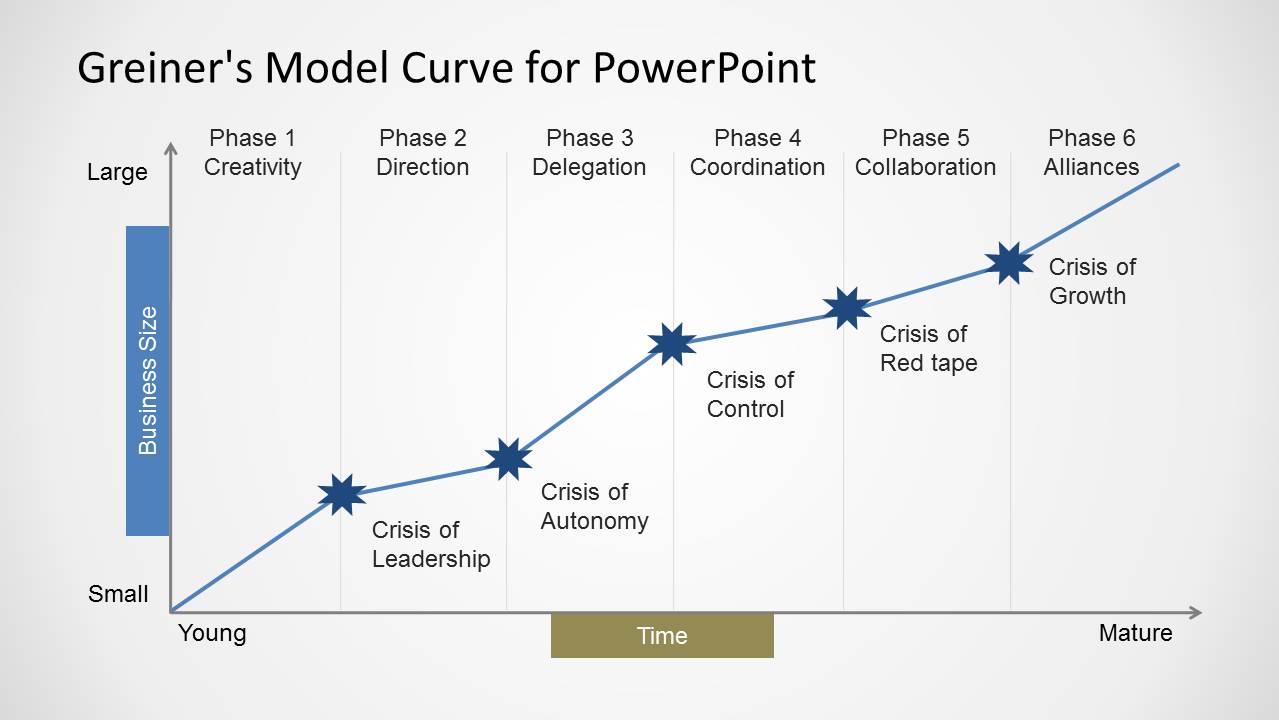
Greiner’s Curve for PowerPoint is a presentation template containing a curve design of the Greiner’s Growth framework and Strategy tool. Greiner’s model is a business growth model and strategy tool developed by Greiner and widely used in organizations to describe the different phases through which a growing company will go. The original version of this model had 5 phases but there are some reworked versions adding a sixth phase called extra-organizational solutions.
Greiner’s framework is often used to understand why and how you should implement different management-styles within the organization or define different organizational structures and coordination methods. This Greiner’s curve can help you to prepare PowerPoint presentations on strategy and business growth. Alternatively you can download other Greiner’s curves.
What’s inside this template
Example presentation scenarios
- A strategy consultant can use the Greiner curve to help an executive team identify which growth phase best matches the organization's current business size and maturity.
- An organizational development leader can use the crisis markers to explain why a leadership, autonomy, control, red tape, or growth crisis may require a change in management style.
- A business school instructor can use the six phase bands to teach the sequence from creativity to alliances in a short lecture on growth models.
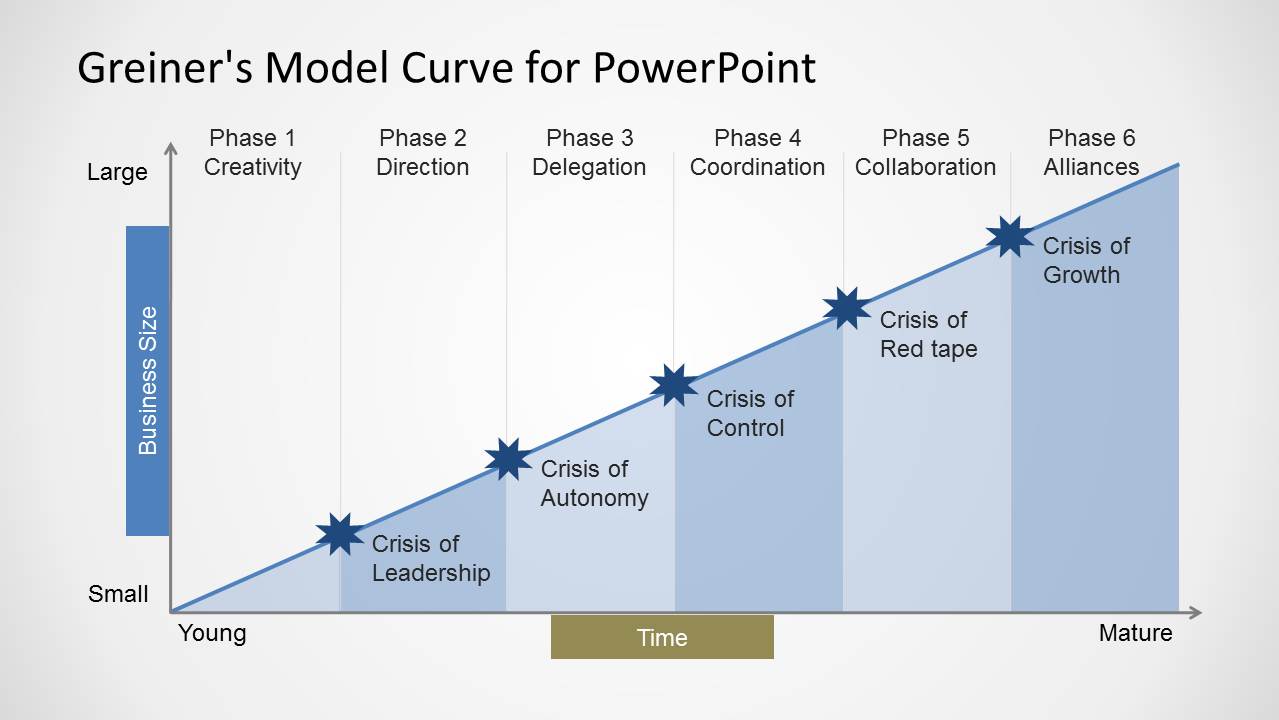
- A founder or CEO can use the shaded area version to brief managers on how complexity expands as the company moves from young to mature stages.
Features
- 100% editable presentation template
- Compatible with Microsoft PowerPoint and Google Slides
- Scalable vector shapes, icons and illustrations
- AI-Ready for Microsoft Copilot and Claude
- Instant access and download
Frequently asked questions
Q: How should a presenter explain the curve without turning it into a theory lecture?
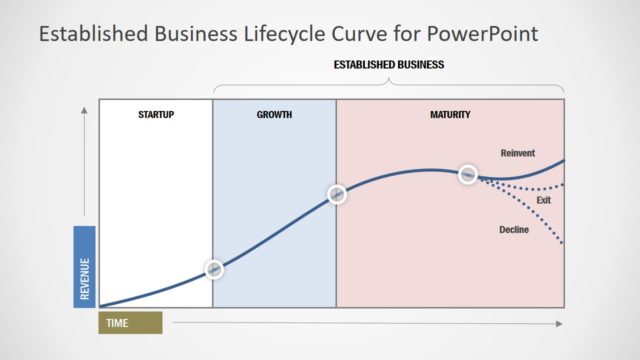
A: Start with the axes: business size grows vertically while time moves from young to mature horizontally. Then move phase by phase and treat each star as a discussion point. Ask the audience which crisis feels most familiar before explaining the management response, so the model becomes a diagnostic conversation rather than a static framework.
Q: Who is this template best suited for in a business presentation?
A: This template fits executives, consultants, and organizational development teams who need to discuss growth-stage risks in a concise way. It is strongest when the audience already understands the company context but needs a shared model for why leadership style, coordination, delegation, and collaboration must change as the organization scales.
Q: Why does the rising curve make the Greiner model easier to understand?
A: The upward curve connects size, maturity, and crisis into one visual path. Phase bands separate the six stages, while star markers make each inflection point memorable. This design helps the audience see crises as predictable transition points in growth, not isolated management problems.
Greiner’s Curve for PowerPoint
2-slide presentation template for Greiner growth curve phases, crisis markers, and business size over time
Greiner's Curve for PowerPoint is a 2-slide diagram template for explaining Greiner's growth model. It shows a six-phase growth curve with phase bands, business size and time axes, star-shaped crisis markers, and an alternate shaded area version. It is intended for strategy, leadership, and organizational growth presentations in PowerPoint.


 Loading...
 Microsoft PowerPoint
  Microsoft Copilot
  Claude for PowerPoint
 Other formats supported
Subscribe today and get immediate
access to download our PowerPoint templates.