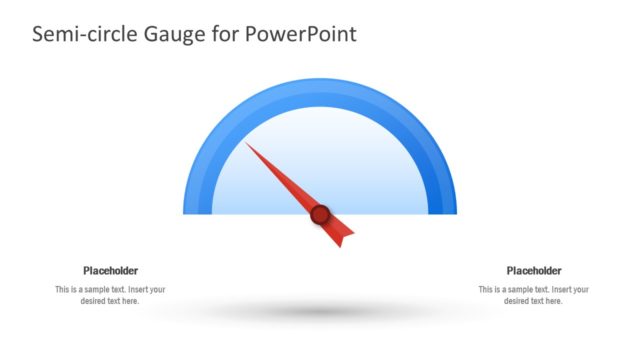
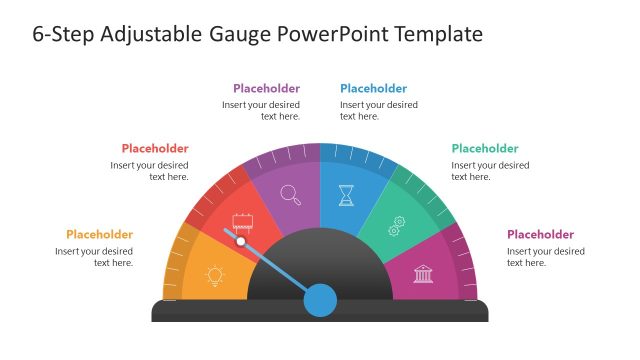
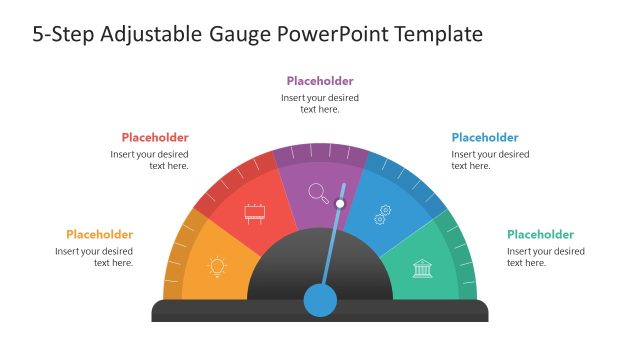
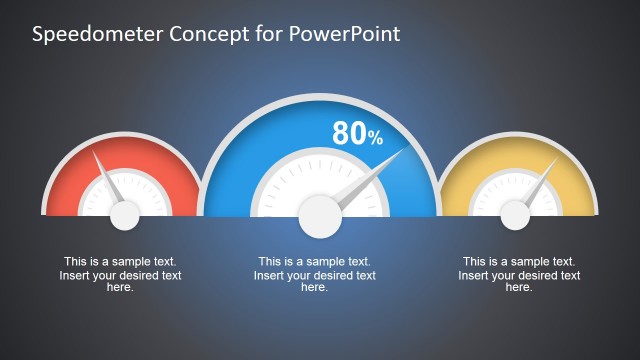
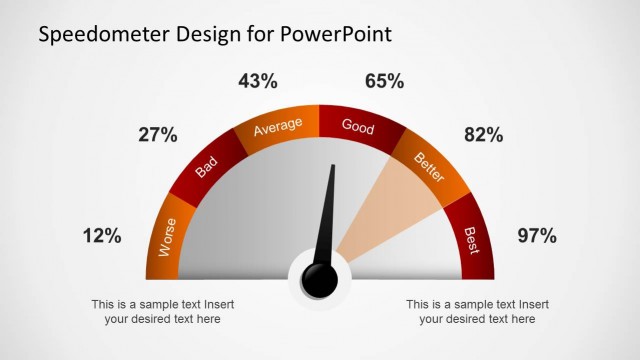
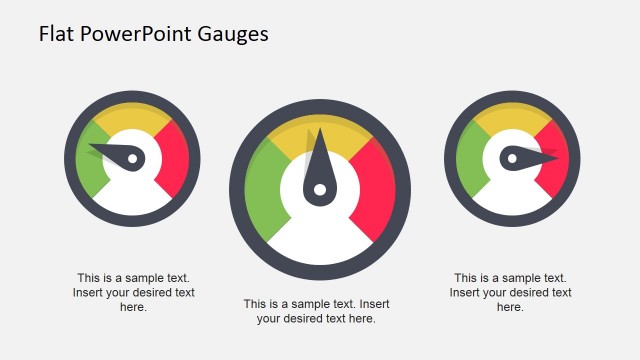
Editable Gauge Concept for PowerPoint is a business gauge design for presentations that you can use in PowerPoint dashboards or to make slides to present your data with creative illustrations and metaphors.
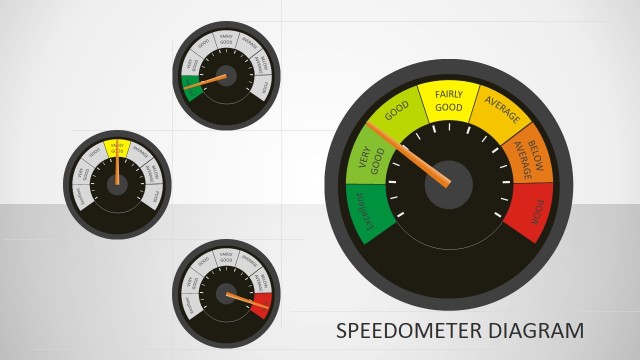
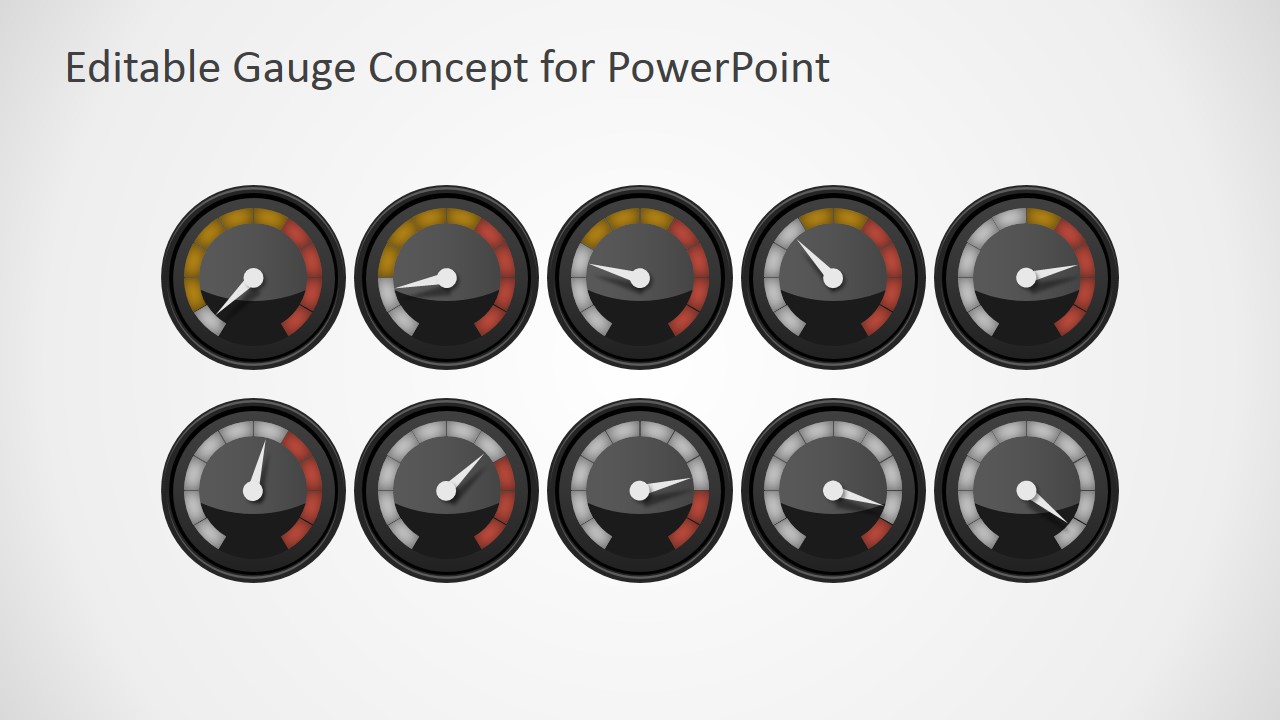
This fully-editable gauge for PowerPoint is perfect for KPI presentations or to present your business performance metrics in a PowerPoint slide with stunning graphics. You can easily adjust the needle to any desired position by ungrouping and rotating the needle shape or you can change the shape colors to red to make a sense of danger or maximum level, for instance if you need to set the level value to the maximum risk level.
For simplicity, there are several gauge shapes in the same presentation slide with different level values that you can copy and paste into your slides.
Alternatively, you can download the free gauge PowerPoint templates for presentations in order you can evaluate the product before subscribing to SlideModel.com
What’s inside this template
Example presentation scenarios
- A project manager can use the orange percentage callout slide to show a milestone at 75% completion and explain whether the current status is near the target range.
- An operations leader can use the single-gauge dashboard slide to present a current service level, defect rate, or utilization status with a fast visual read.
- A consultant can use the two-gauge comparison layout to compare before-and-after performance, two departments, or two risk profiles in one slide.
- A business analyst can use the gauge icon set to build a compact executive dashboard with several status indicators on one page.
Features
- 100% editable presentation template
- Compatible with Microsoft PowerPoint and Google Slides
- Scalable vector shapes, icons and illustrations
- AI-Ready for Microsoft Copilot and Claude
- Instant access and download
Frequently asked questions
Q: How should a presenter use the gauge metaphor without oversimplifying the metric?
A: Use the gauge as a headline signal, then support it with a short explanation beside the graphic. The callout slides work best when the percentage is the main takeaway and the text explains what the value means, such as risk, progress, or readiness. Avoid placing too many unrelated metrics on one gauge slide.
Q: Who is this template best suited for in a business presentation?
A: This template fits managers, analysts, and consultants who need to communicate a current state quickly. It is strongest for performance reviews, executive updates, operational dashboards, and project status meetings where the audience needs an immediate read on whether a metric is low, acceptable, or high.
Q: Why do the red, orange, and green gauge bands help the message?
A: The color bands create a familiar status metaphor: green for acceptable, orange for caution, and red for concern. This lets the audience interpret the needle position before reading the text. The design is useful when the presenter wants to reduce explanation time and focus discussion on causes, actions, or thresholds.




Editable Gauge Concept for PowerPoint
6-slide presentation template with editable gauge meters, KPI callouts, and speedometer dashboard graphics
Editable Gauge Concept for PowerPoint is a 6-slide gauge graphics template for performance, risk, and progress presentations. It includes a title slide, single-gauge dashboard layouts, a two-gauge comparison slide, percentage callout slides, and a gauge icon set. It is built for Microsoft PowerPoint and Google Slides.


 Loading...
 Microsoft PowerPoint
 Microsoft Copilot
 Claude for PowerPoint
Other formats supported
Subscribe today and get immediate
access to download our PowerPoint templates.