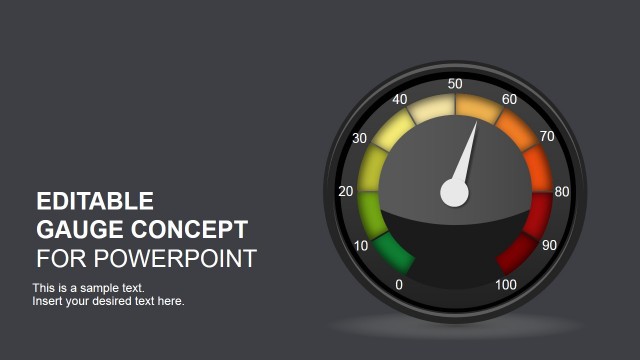
Gas Gauge PowerPoint Shapes
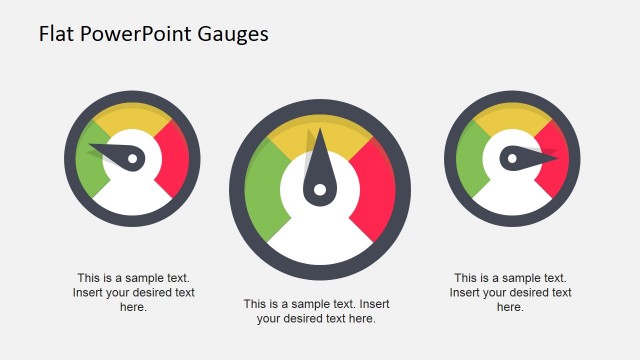
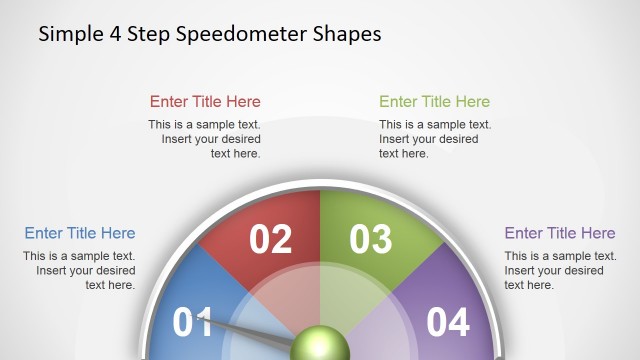
Fully-editable Gas Gauge Illustration for PowerPoint is a presentation design created with PowerPoint shapes that you can use as an alternative to show numbers in your PowerPoint slides. This fully editable gauge graphic for PowerPoint let you adjust the needle to match any desired level using a gas gauge analogy.
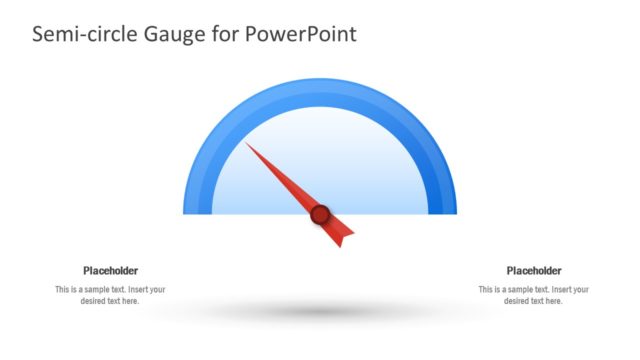
It is very easy to copy the gauge multiple times into any slide and make comparisons in PowerPoint. For instance, you can compare project measurements or make attractive dashboards in PowerPoint with cool presentation graphics.
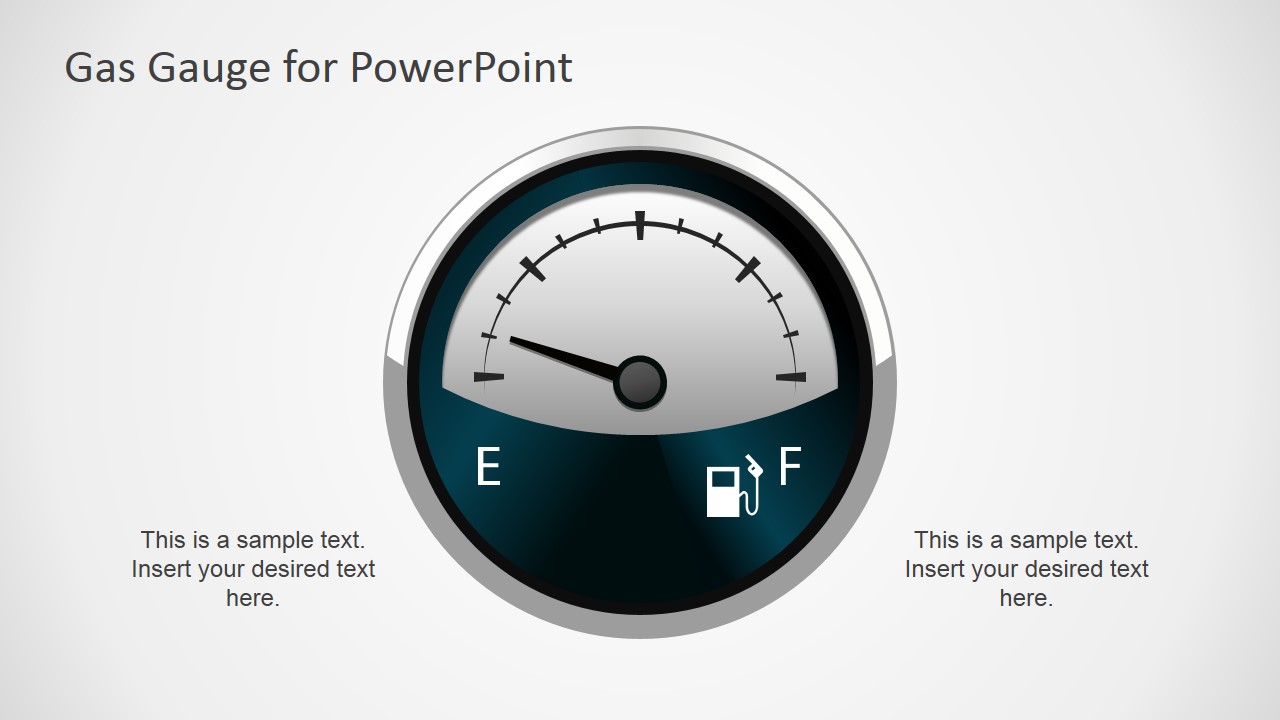
Moreover, taking advantage of this full-editable PowerPoint gauge graphic you can easily change the shape properties to match your presentation needs. Given that this gauge graphic for PowerPoint was created with shapes or as PowerPoint object, you can change the gauge colors or resize the shapes without compromising the slide image quality. Or if you prefer, you can ungroup the shape and manipulate the objects to make other cool designs. Using the visual PowerPoint gauge design you can make an impact in your audience.


You must be logged in to download this file.
DOWNLOAD- Category
- Shapes
- Rating


 Loading...
- Size
- 16x9
- Item ID
- 6954-01
- Colors
Subscribe today and get immediate
access to download our PowerPoint templates.