Costing Continuum Levels of Maturity PowerPoint Diagram
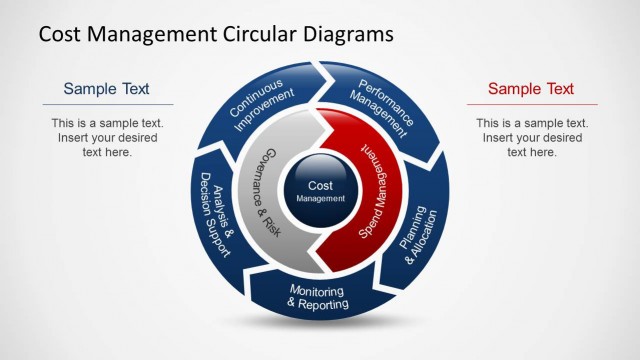
The Costing Continuum Levels of Maturity PowerPoint Diagram is highly professional financial presentation. This PowerPoint template has erudite design of the costing continuum model. This is an extremely sophisticated modeling technique used by organizations where finances are micromanaged. Typically, product price is calculated with resources involved. However, this accounting technique gives maximum level of accuracy, transparency and ability to forecast.
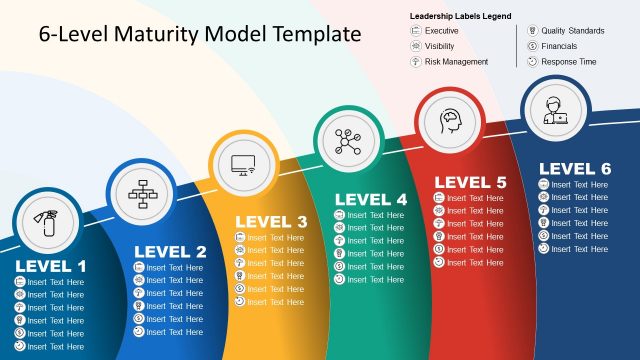
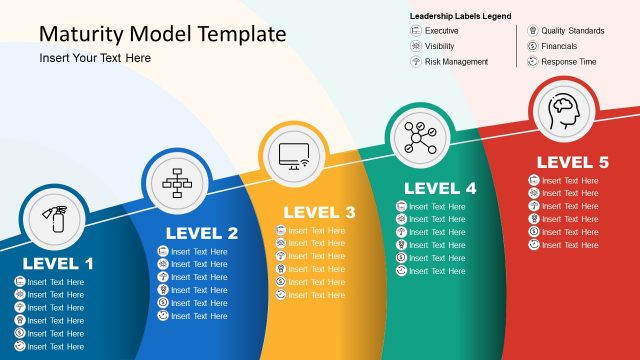
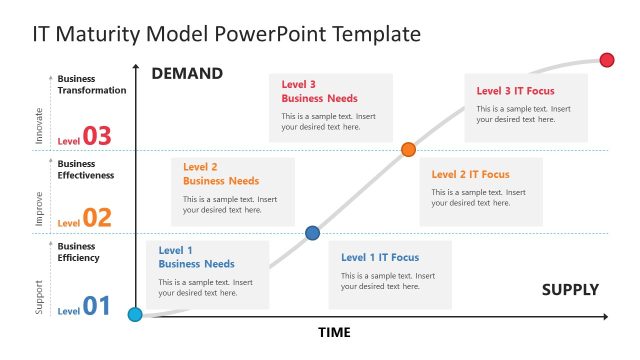
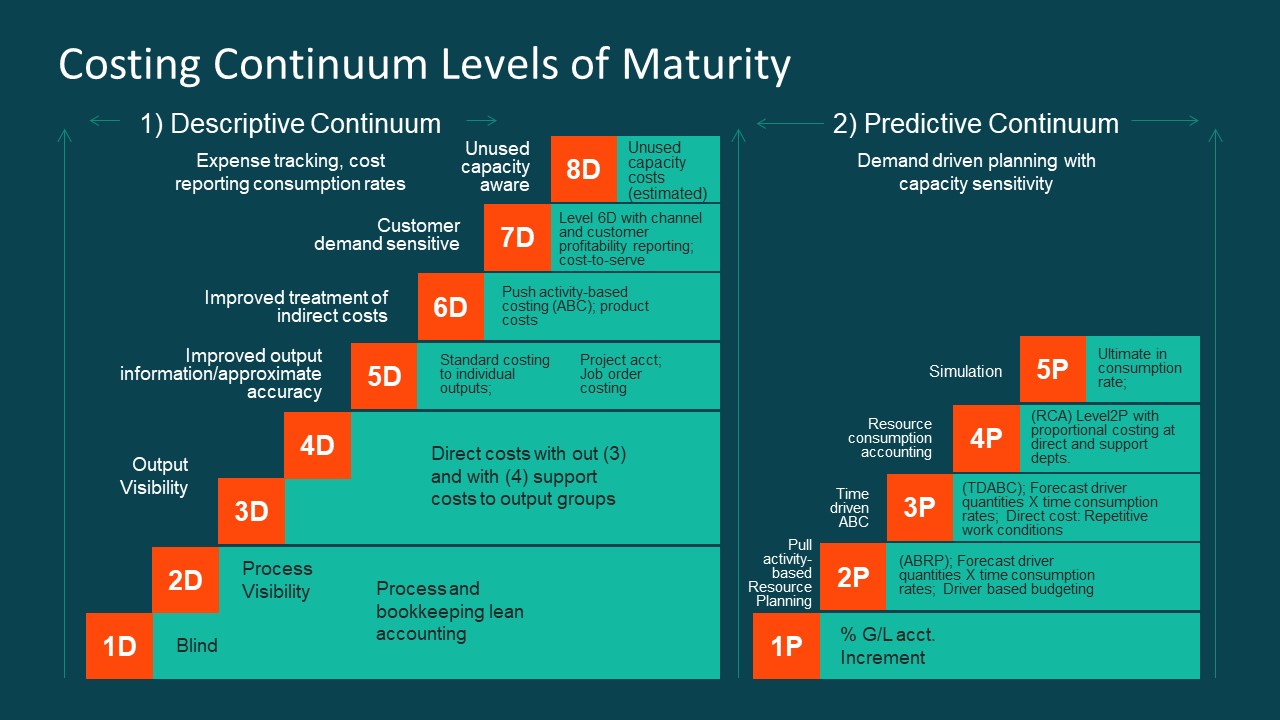
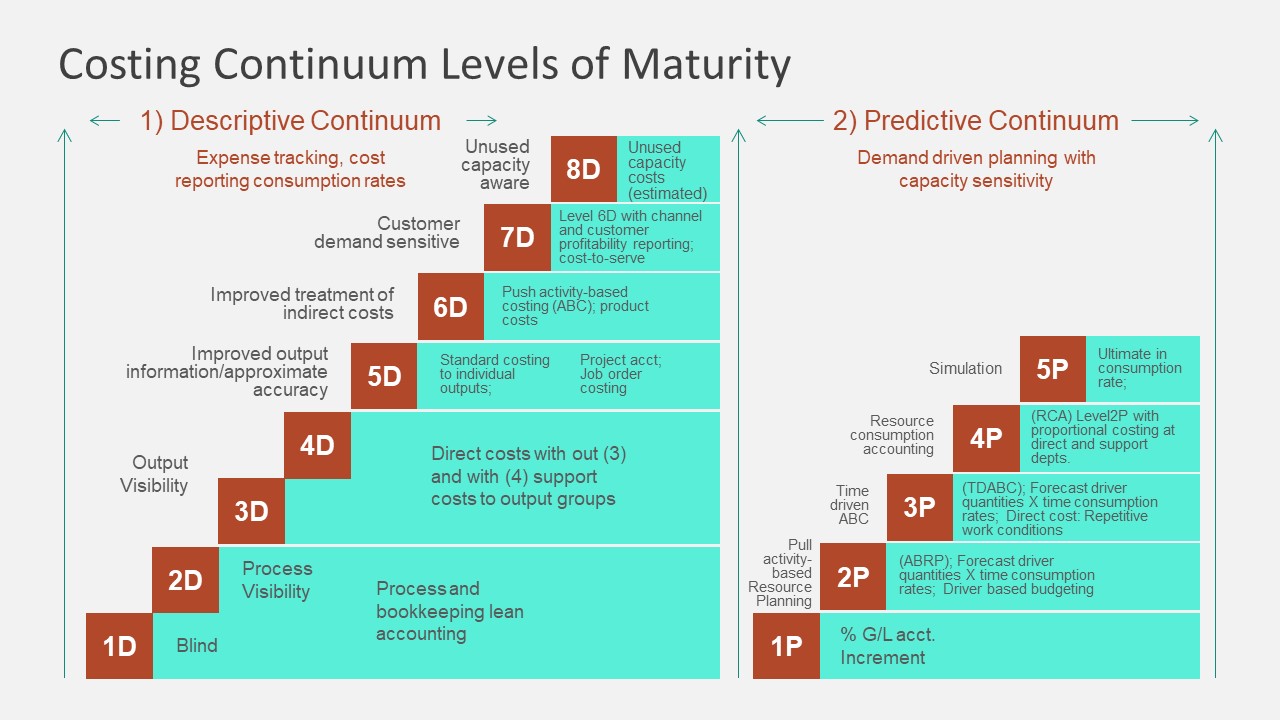
The costing continuum maturity model has total 12 levels. Divided into two separate sections; i.e. descriptive continuum and predictive continuum. As a result, it aids organizations in self-assessment to identify available capabilities and how they impact the advanced levels. Most of all, this model first estimates future costs based on historical data and identifies the limitations on available approaches for improvement. It is an ideal technique, where managerial decisions are involved such as inventory, product design, pricing and other special decisions. The costing continuum maturity model gives a comprehensive pricing structure applicable to every component involved in development.
The Costing Continuum Levels of Maturity PowerPoint Diagram template has 2 seamless slides containing 12-step model with different background in each. The presentation design has conceptual division of levels in 2 labeled vertical sections. The first section of expenses has 8 stages and next segment of demand has 6 steps. The color theme of diagram is initially bluish-green and it is customization. The template itself contain all the labels defining each level and output/deliverable of several stages. This pre-designed template demonstrates simplicity with self-descriptive presentation for the audience.
The Costing Continuum Levels of Maturity PowerPoint Diagram is exceedingly necessitated template of financial and accounting professionals and companies of core financial services. As a result, the organizations always need a proper supply and demand analysis and cost information helps with the visibility, budgeting and decision making.
You can find and download several Business PowerPoint Templates from our Professional Gallery.


You must be logged in to download this file.
DOWNLOAD- Category
- Models
- Rating

 Loading...
- Size
- 16x94x3
- Item ID
- 7454-01
- Colors
Subscribe today and get immediate
access to download our PowerPoint templates.