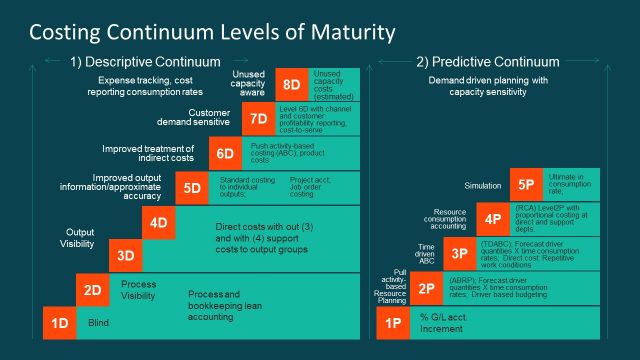
Descriptive and Predictive Continuum Maturity
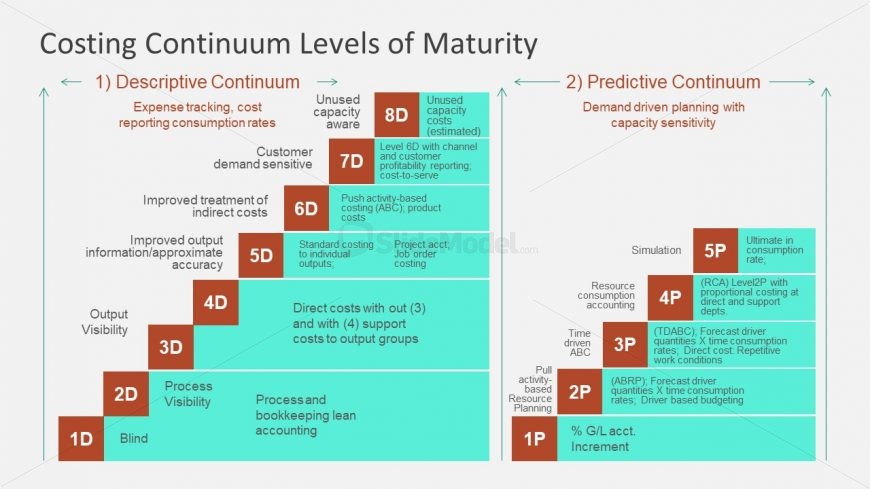
The plain background slide of Costing Continuum Levels of Maturity PowerPoint Diagram is a finance and accounting template. This presentation methodology is a self-explanatory diagram of descriptive and predictive continuum model. The stair shape stages define basic concept of this model which is helpful to use it as educational PowerPoint. The business professionals can use it to train students and staff about the concept of cost continuum levels of maturity. However, the users can also edit this template to make it more relevant to the topic. This 12-level diagram helps companies to organize and micromanage their finance at an executive level.
Return to Costing Continuum Levels of Maturity PowerPoint Diagram.