Impress professional audiences with the content and graphics contained in the Cost Management PowerPoint Diagrams. Using the template, the presenter can effectively discuss the different principles and theories behind cost management. This allows the audiences to gain a common ground concerning the understanding of the terms.
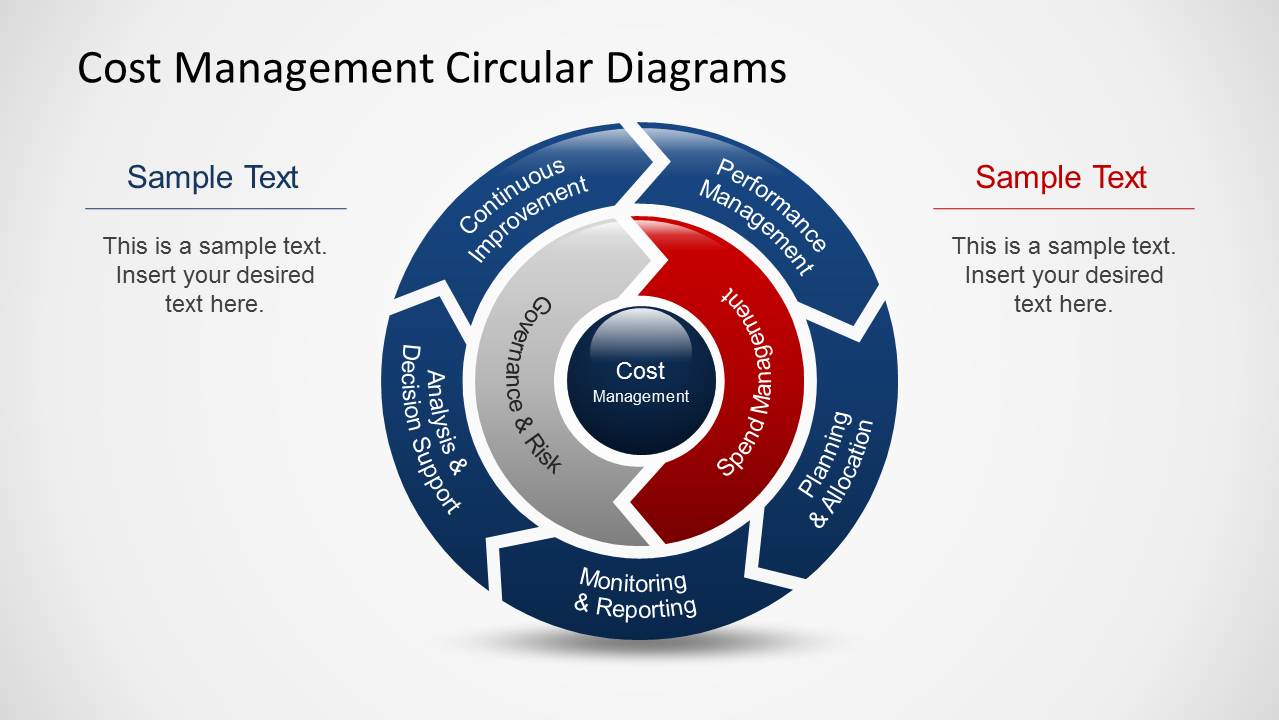
Cost management, as featured in the slide designs, refers to the process of plotting, monitoring, and controlling specific costs related to the company’s projects. Also referred to as Project Cost Management, or PCM, it is helpful in determining the different weights of expenses incurred during the cost of production.
This methodology involves specific budget requests and forecasts to establish the project’s needed funds and manpower. This also allows the company to give leeway for unexpected expenses. Ironically, these are already included in the allowance specifically for this reason. However, these expenses must also remain relevant to the project, in order to ensure product quality.
Through different performance management and project management methods, the team leaders, and the project team, itself, are tasked with staying within the allotted budget shown in the estimates. This stage involves careful planning and allocation of resources.
Any discrepancies are then thoroughly analyzed, whether they have been done in bad faith, or have occurred in the natural process of the business. The team then eliminates any unnecessary procedures and materials in order to cut down on costs and stay within budget, should the necessity arise. These must gain decision support from the management to ensure that the process is done according to quality management specifications.
The presenter can also opt to download other PowerPoint templates from the Gallery, like the Muda 7 Types Of Waste PowerPoint Template and describe cost optimization options.
The cost management methodology allows management to facilitate continuous improvement. By setting goals and incentives for teams to work as efficiently an as effectively as possible, the company can reduce costs, merely by proper governance.
The Cost Management PowerPoint Diagrams are effective and informative in terms of topic discussion. They are helpful in illustrating the different aspects of cost management in such a way that each stage can be discussed separately and effectively. By clarifying the importance and roles of cost management, the presenter can make sure that the audience has clearly understood the discussion.
What’s inside this template
Example presentation scenarios
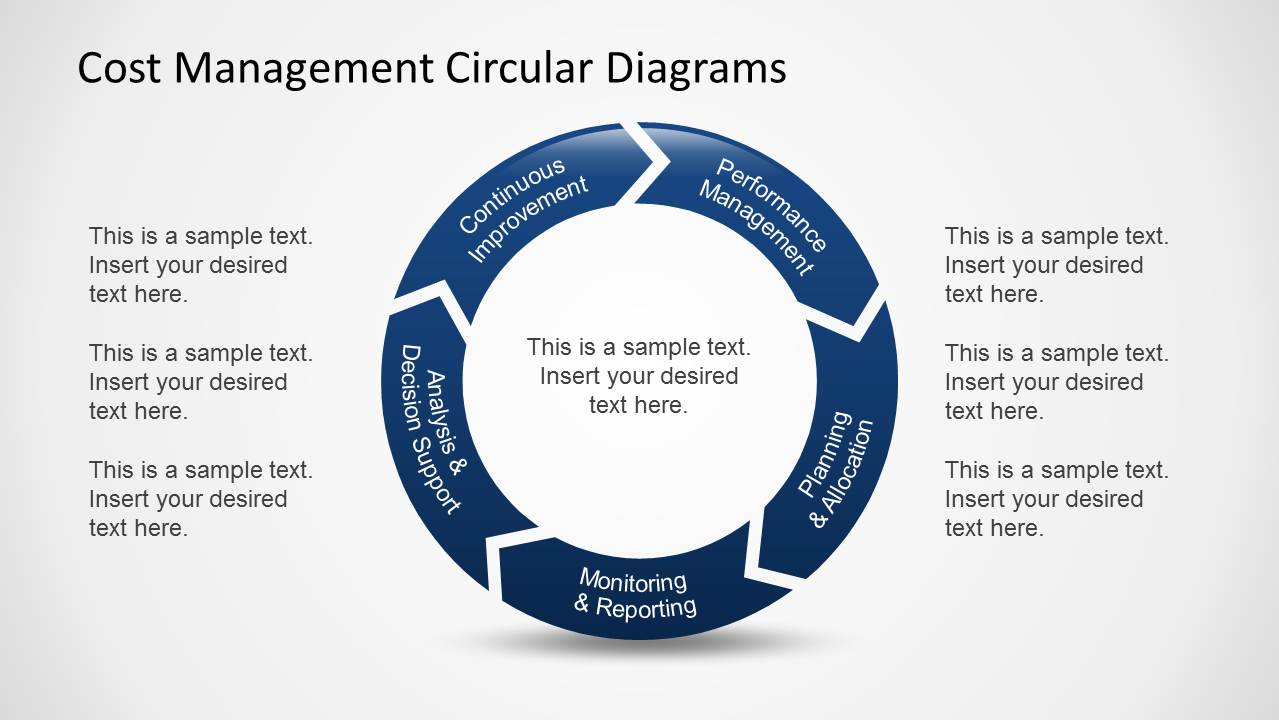
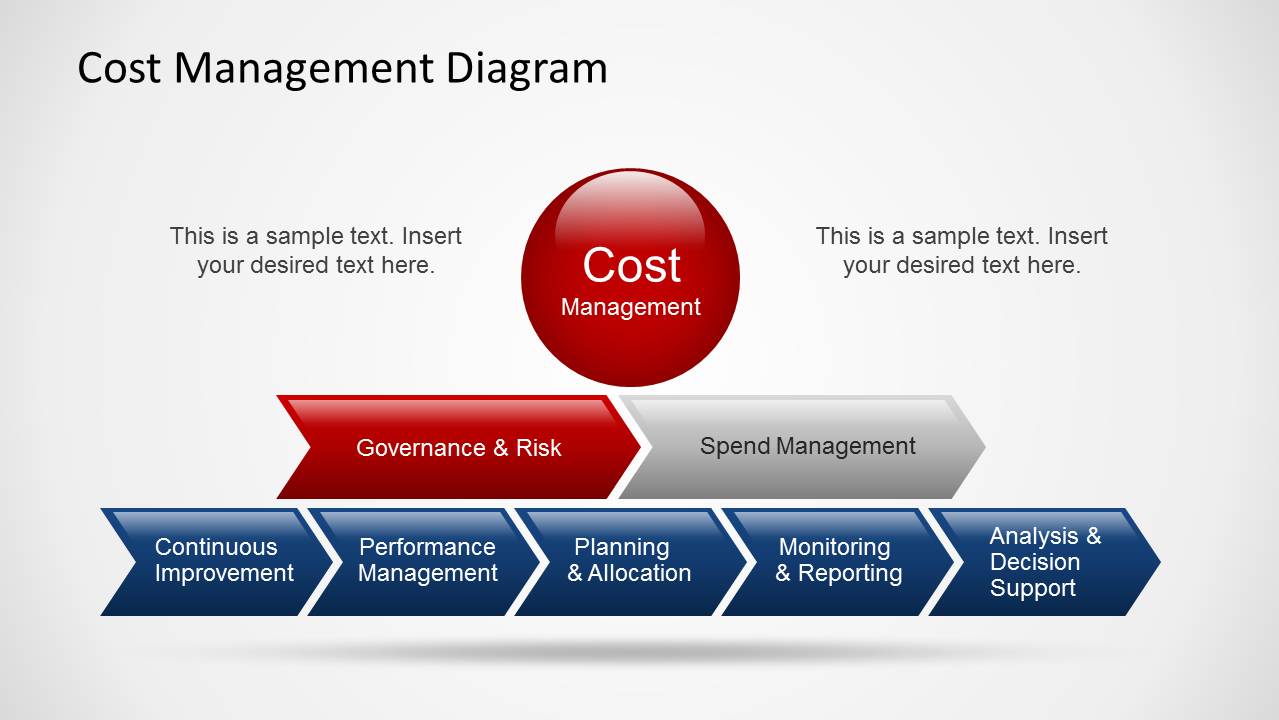
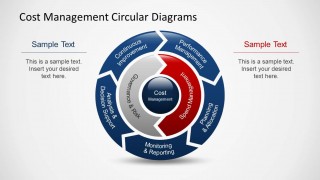
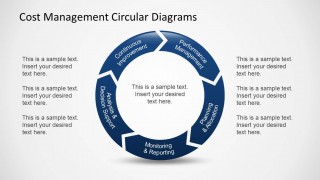
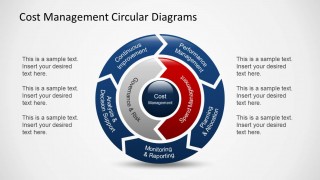
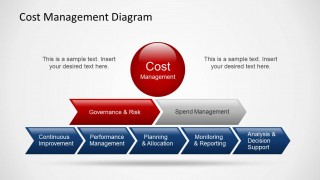
- A PMO manager can present a project cost control method by walking stakeholders through the 5-step circular cycle and the horizontal chevron process flow.
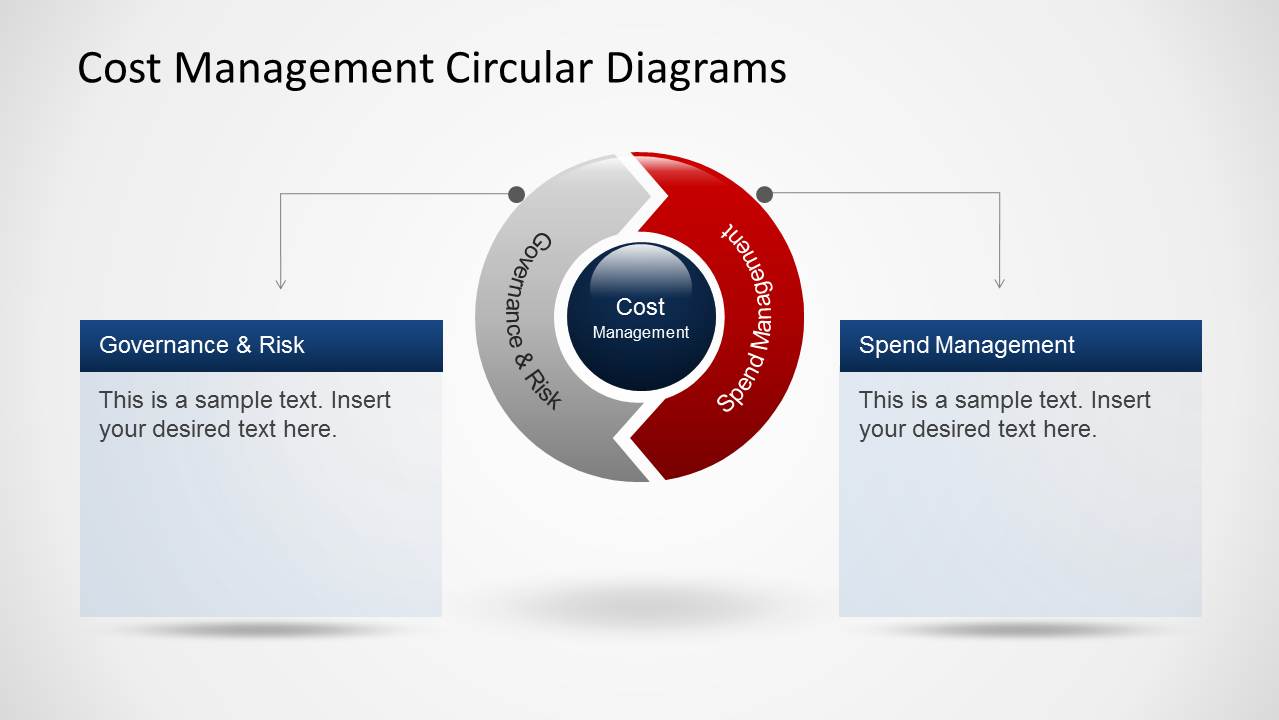
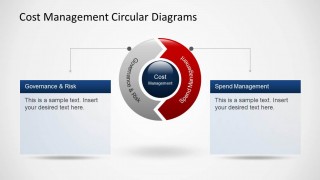
- A finance leader can align department heads on spend governance by comparing Governance & Risk with Spend Management using the two-part circular diagrams.
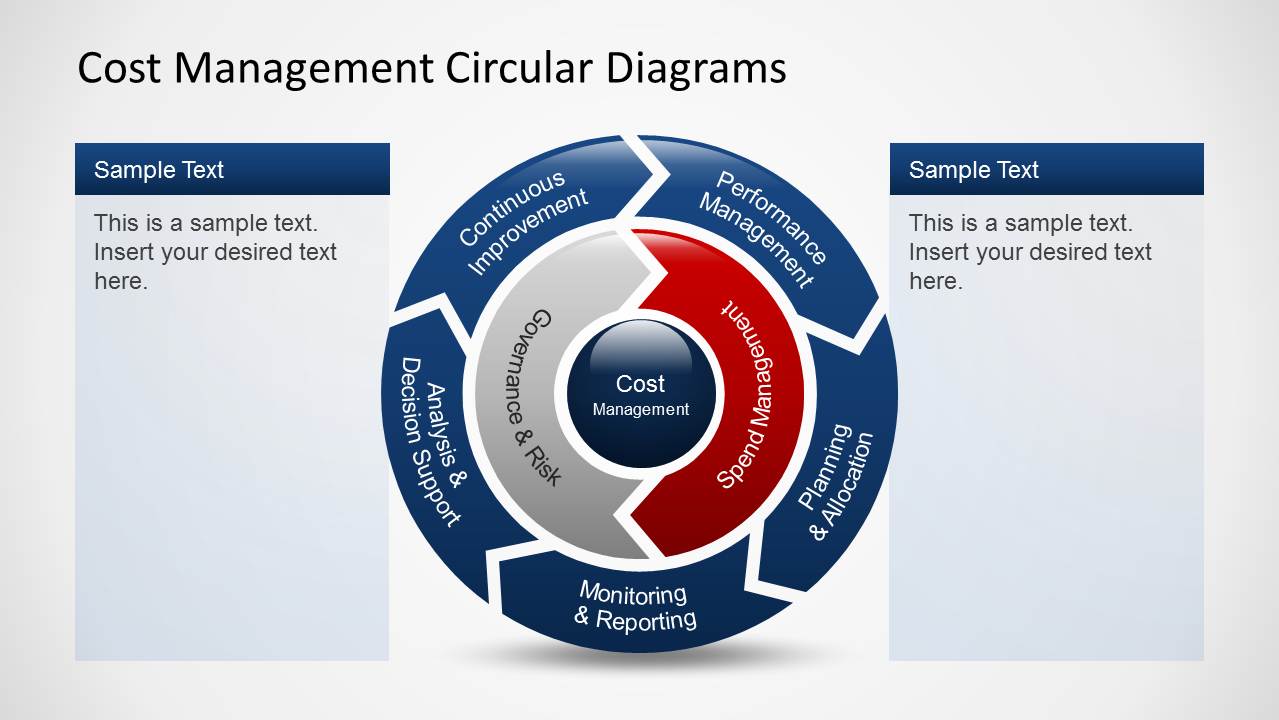
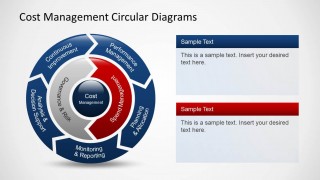
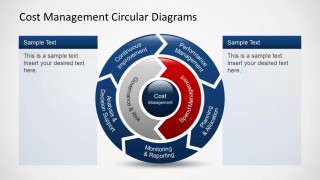
- A consultant can explain a cost reduction framework to an operations team by using the circular cycle with side callouts for responsibilities, risks, and review points.
- A project manager can support a budget review meeting by using the monitoring, reporting, analysis, and decision support stages to discuss where corrective actions are needed.
Features
- 100% editable presentation template
- Compatible with Microsoft PowerPoint and Google Slides
- 16:9 aspect ratio slides
- Scalable vector shapes, icons and illustrations
- AI-Ready for Microsoft Copilot and Claude
- Instant access and download
Frequently asked questions
Q: How should a presenter explain the cost management message with these diagrams?
A: Start with the full circular cycle to show that cost management repeats rather than ends after a single budget decision. Then move to the chevron flow when the audience needs a step-by-step operational view. Use the side callout slides for definitions, owner responsibilities, and key questions that guide discussion at each stage.
Q: Who is this template best suited for in a business presentation?
A: It fits presenters who need to align non-finance stakeholders around cost control behavior, especially project managers, PMO teams, finance leaders, and operations consultants. The diagrams are strongest when the message is process clarity: who monitors costs, how spend is governed, where decisions are made, and how improvement feeds back into planning.
Q: Why use a circular cost management metaphor instead of a linear list?
A: The circular arrows show cost management as a recurring discipline, not a one-time checklist. That visual metaphor helps audiences see why monitoring, analysis, performance management, and continuous improvement keep looping back into governance and spend decisions. The two-color inner ring also separates governance and spend management without breaking the cycle.



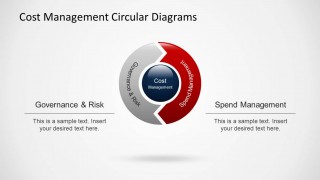
Cost Management PowerPoint Diagrams
8-slide cost management presentation template with circular process diagrams and governance steps
Cost Management PowerPoint Diagrams is an 8-slide diagram template for explaining project cost control, governance, and spend management. Visible layouts include a 5-step circular cycle, horizontal chevron process flow, side-by-side comparison panels, and text callout variations. It is designed for finance, PMO, operations, and consulting presentations in PowerPoint and Google Slides.
- Category
- Diagrams
- Rating


 Loading...
- Aspect ratio
- 16:9, 4:3
- Item ID
- 6308-01
- Colors
 Microsoft PowerPoint
  Microsoft Copilot
  Claude for PowerPoint
 Other formats supported
Subscribe today and get immediate
access to download our PowerPoint templates.