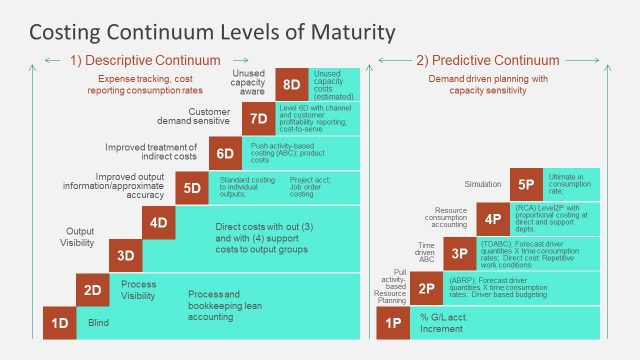
Cost Continuum Diagram in PPT
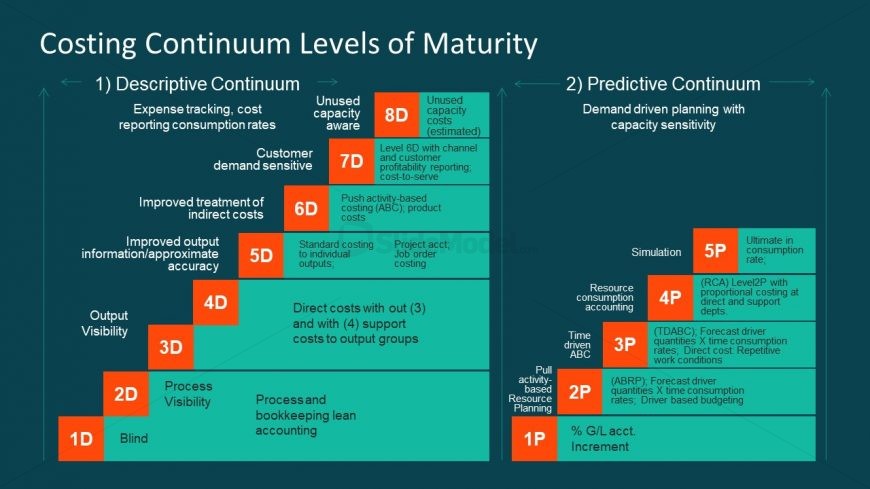
The Costing Continuum Levels of Maturity PowerPoint Diagram is a self-explanatory professional template of organizational finance management. It shows the financial levels to attain maturity via PowerPoint. The cost levels of descriptive and predictive continuum appear separately for an easy understanding. The placeholders on each stage define the concept of this model. This high impact slide is usable for education purpose without additional changes is text. However, the finance professionals can use extract relevant information from predefined segments and create their own content. The template uses strong color theme for greater visibility for the audience.
Return to Costing Continuum Levels of Maturity PowerPoint Diagram.