Chemical Industry Shapes for PowerPoint
The Chemical Industry Shapes for PowerPoint is a compilation of industrial diagrams and visuals. The diagrams point to different procedures and tools used in the chemical industry. These slides help elaborate on various industrial phenomena in academic or industrial presentations.
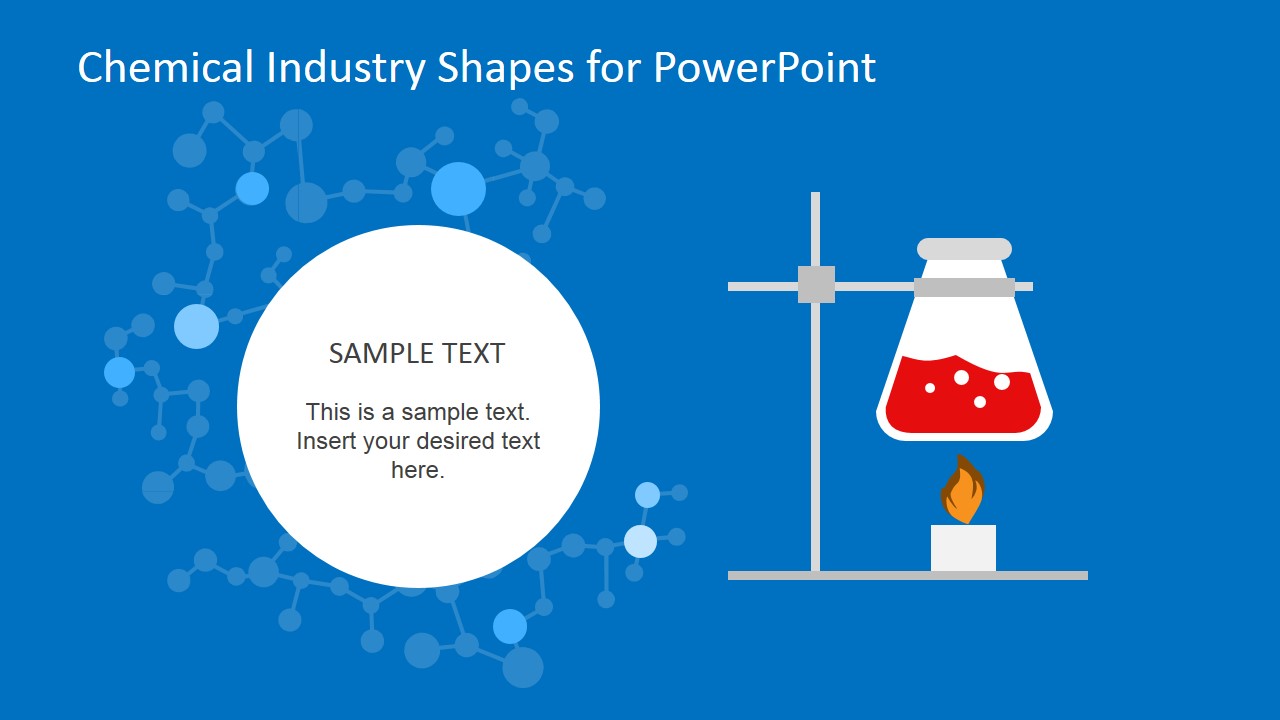
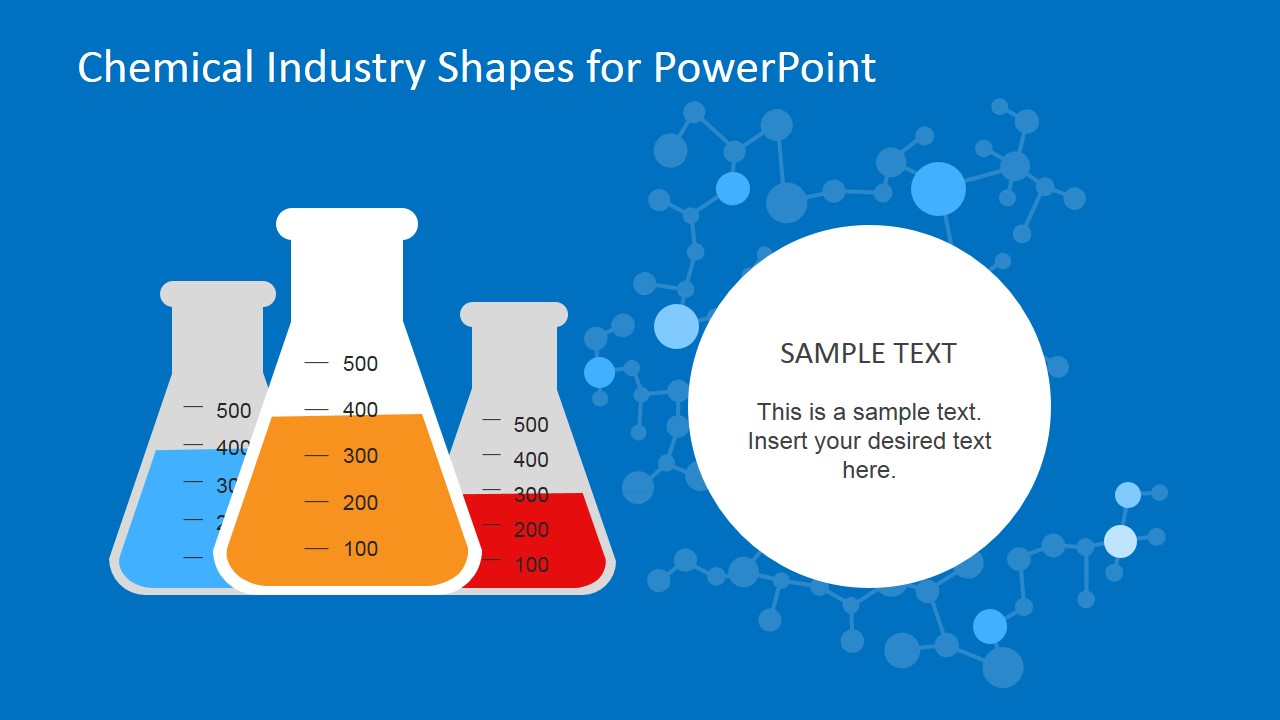
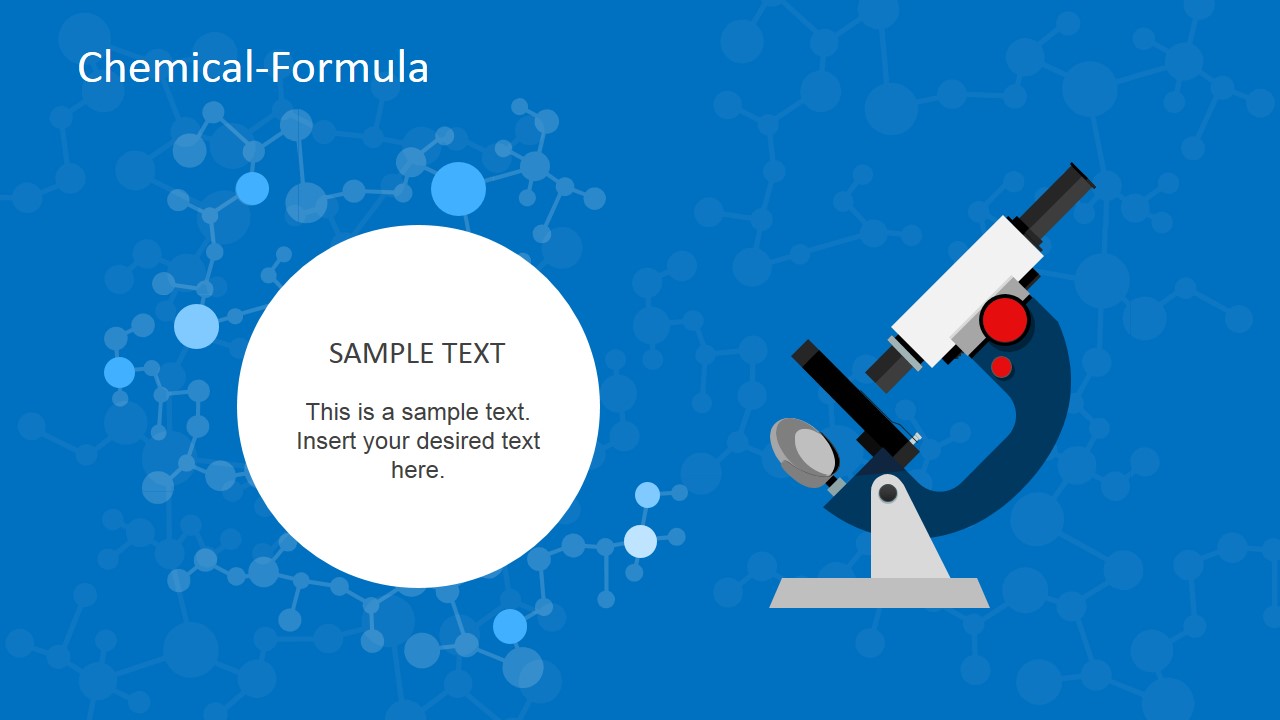
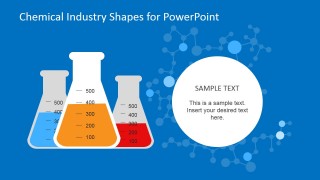
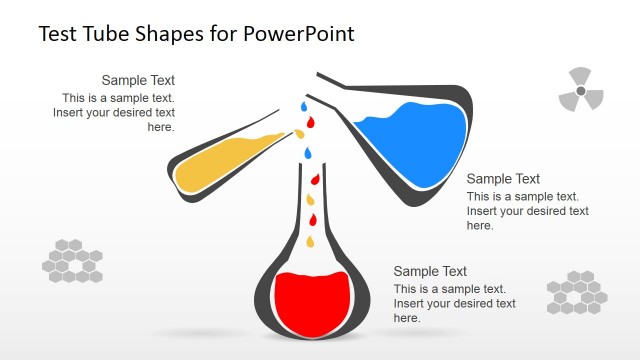
The first slide shows the concept of fractional distillation. It contains a flask on the flame, and afterward, the components of this mixture are shown separated into three different test tubes. The following four slides are a continuation of this idea where heating, solutions in graduated flasks, and test tubes containing each component are displayed progressively. Text boxes on all the slides are used to add relevant details. The slide with a microscope diagram can help explain the importance of a light microscope in the chemical industry.
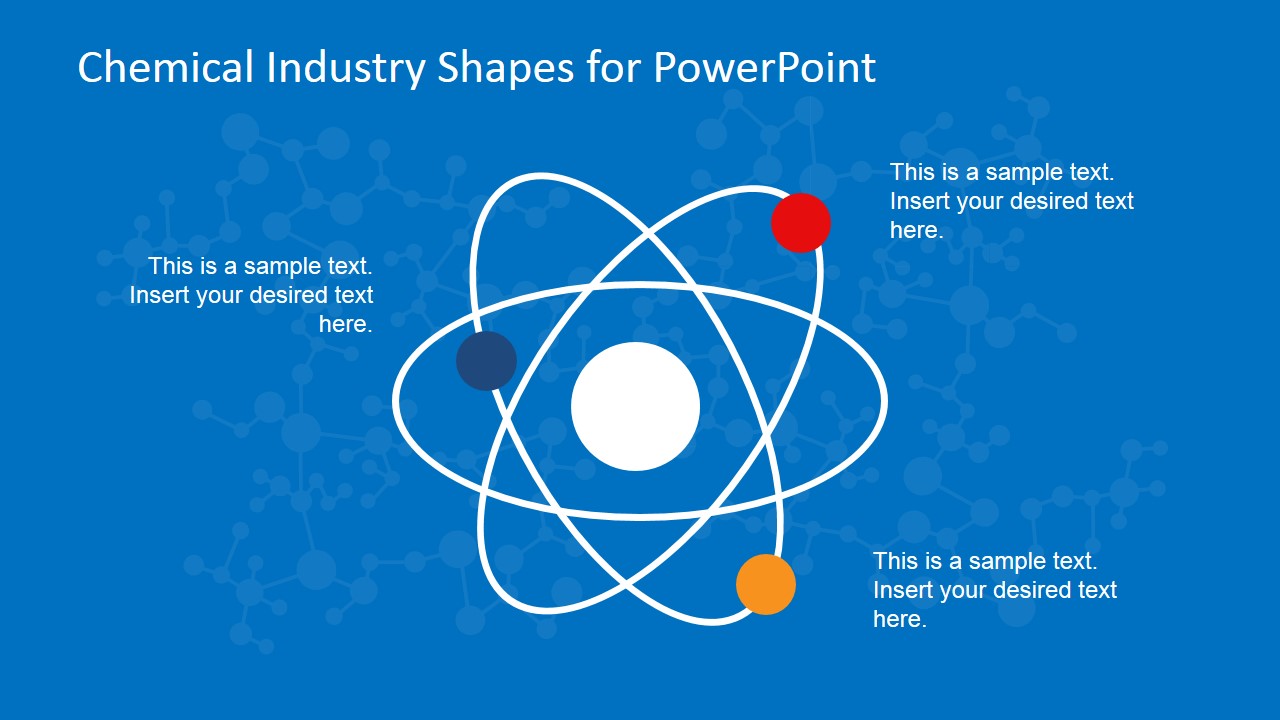
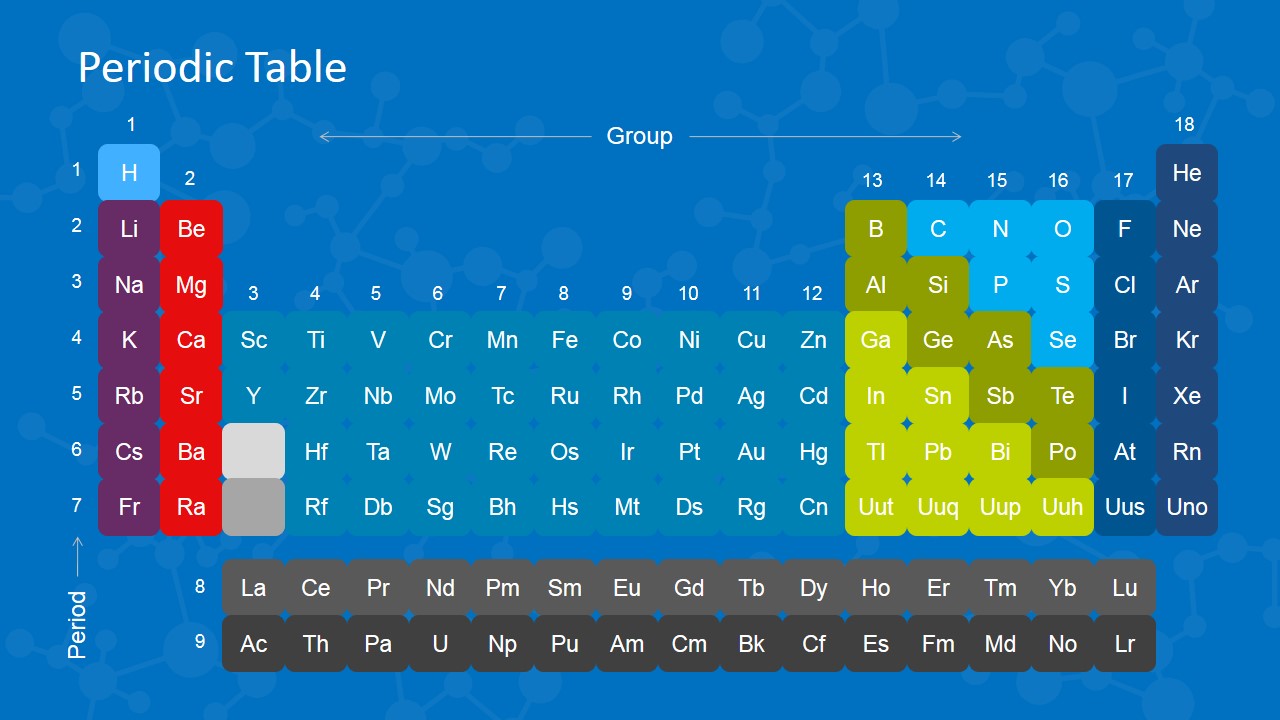
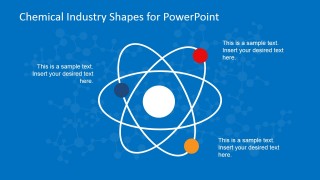
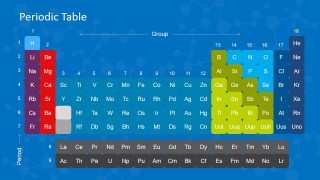
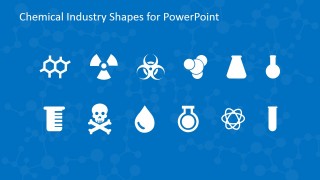
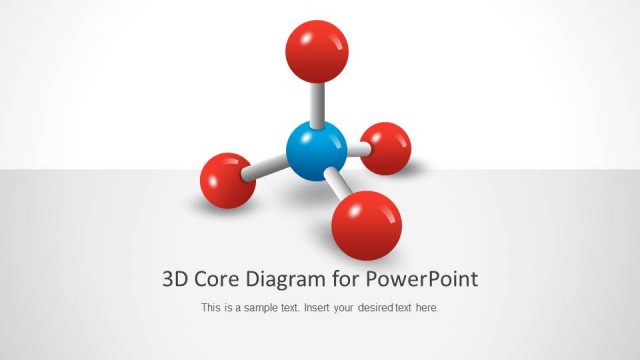
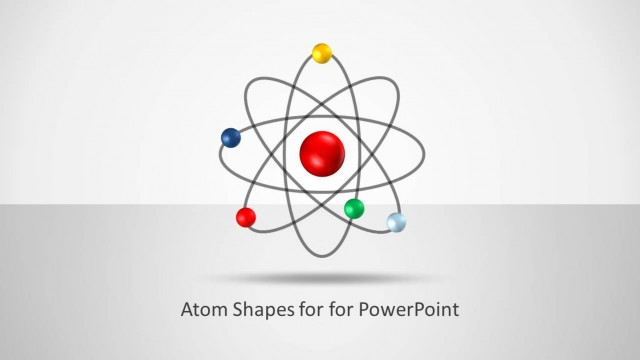
The periodic table slide shows each elements group with distinct colors. It is an electronegativity chart that can be studied for various elemental characteristics. If you want to have a descriptive model of the periodic table, you can also download the Periodic Table of Elements template and customize it accordingly. The last two slides display several icons or symbols commonly used in the chemical industry. The template also has a slide with atom shapes and visuals of chemical formulas drawn on it.
The Chemical Industry Shapes for PowerPoint is designed for researchers, industrial management teams, or other institutions which deal in chemicals or their business. Simple ideas can become much more interesting through catchy diagrams and the template’s color scheme. This template is easily editable on any version of PowerPoint and Google Slides. Users can change colors, shapes, and placement of objects accordingly.

