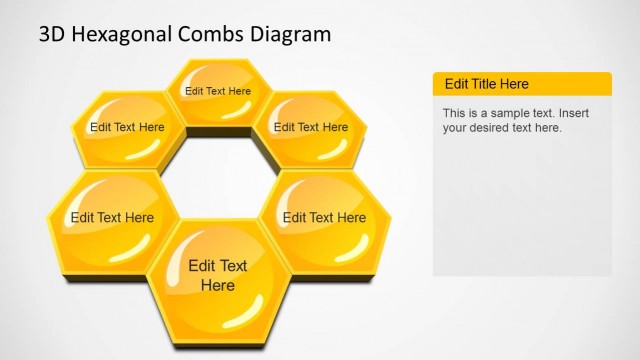
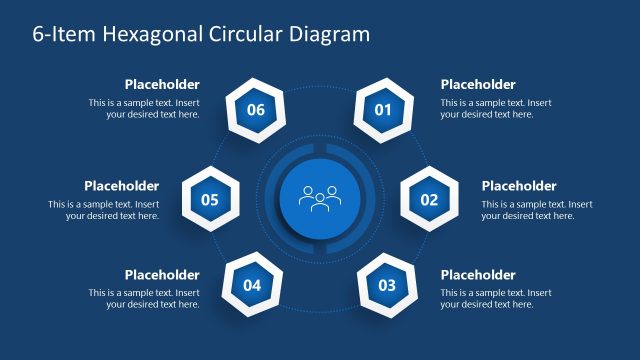
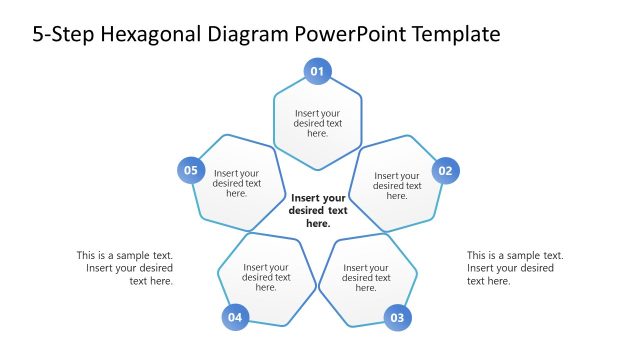
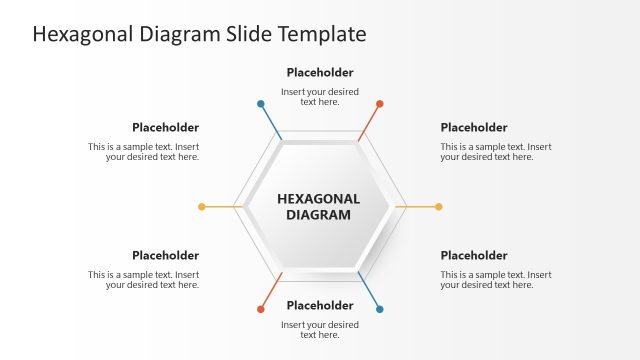
The Simple Science Diagram Design for PowerPoint can be used to create helpful presentations for any type of science report. Impress corporate audiences with the trendy, minimalist design of the PowerPoint slides. The template design contains a hexagon diagram resembling a beehive illustration.
The PowerPoint template can be used to show a set of elements in the slide related to science or laboratory. These can include five connected components each illustrated by a hexagon. There are seven hexagonal shapes in total, with five containing minimalist icons, and two containing text placeholders. The hexagons are arranged in a bee hive pattern, with several shapes connected by the edges.
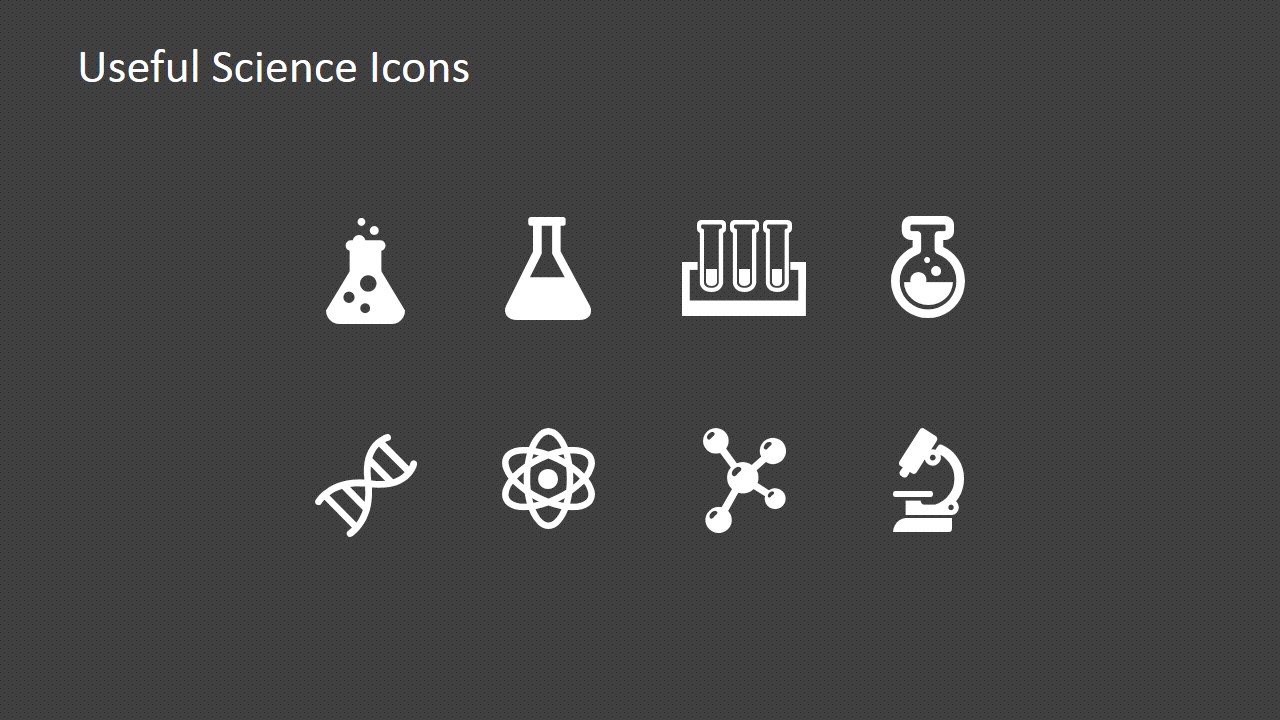
Also included in the PowerPoint template is a set of eight minimalist icons. These include symbols for laboratory equipment, such as beakers, Erlenmeyer flasks, round bottom flasks, test tubes and a microscope. The three remaining symbols on the PowerPoint slide represent structures, such as the DNA double helix, the electron field and the molecular structure of an element or compound.
The laboratory apparatus can be used to represent the different tools and equipment needed in a marketing research. The presenter can emphasize the containment, reactions, and observations related to the plan or report by using these generic icons. The structures, on the other hand, can be used to show the composition and identity of the various components featured on the presentation.
Ideal for presenting several elements of a business plan in an easy summary structure, the Simple Science Diagram Design for PowerPoint can be used in any type of business presentation. The PowerPoint template can be reused for other types of reports. The presenter can fully customize the contents of the presentation design so they can be edited to the presenter’s needs and preferences.
The presenter can also download other PowerPoint templates from the Gallery, such as the Test Tube Shapes for PowerPoint.
What’s inside this template
Example presentation scenarios
- A researcher can use the hexagon diagram to explain five related components of an experiment while reserving the two text cells for key findings or labels.
- A science educator can introduce a lab unit by assigning the icon sheet symbols to topics such as DNA, microscopy, chemical reactions, and molecular structures.
- A biotech or healthcare presenter can summarize a research workflow by replacing the sample text in the hexagon cluster with project stages or technical categories.
- A business analyst can use the connected hexagons to map science-related market factors, then use the laboratory icons as visual labels for each factor.
Features
- 100% editable presentation template
- Compatible with Microsoft PowerPoint and Google Slides
- Scalable vector shapes, icons and illustrations
- AI-Ready for Microsoft Copilot and Claude
- Instant access and download
Frequently asked questions
Q: How should I present the hexagon diagram so the audience understands the relationships quickly?
A: Use the center and adjacent hexagons as a relationship map, not as a list. Put the main scientific idea or research theme in the most prominent text cell, then assign one icon per supporting concept. Keep labels short so the beehive structure communicates grouping and connection before the audience reads every detail.
Q: Who is this template best suited for in a science or business presentation?
A: This template works best for researchers, educators, analysts, and project leads who need to summarize connected scientific ideas in a short segment. The hexagon layout fits concept overviews, lab component explanations, and STEM lessons. It is less suited to deep experimental results because it does not include tables, charts, or report sections.
Q: Why use a hexagon and beehive-style diagram for science content?
A: The hexagon cluster creates a modular metaphor: each cell can represent one component, tool, or concept while the shared edges imply connection. This helps a presenter show that the science topic is made of related parts rather than isolated bullets. The icon sheet reinforces meaning with recognizable lab and molecular symbols.


Simple Science Diagram Design for PowerPoint
2-slide science diagram presentation template with hexagon cluster and laboratory icons
Simple Science Diagram Design for PowerPoint is a 2-slide diagram template for science reports and lab-themed business content. It includes a connected hexagon diagram with science icons, text placeholders, and a separate icon sheet with beakers, flasks, DNA, atom, molecule, and microscope symbols for Microsoft PowerPoint and Google Slides.


 Loading...
 Microsoft PowerPoint
 Microsoft Copilot
 Claude for PowerPoint
Other formats supported
Subscribe today and get immediate
access to download our PowerPoint templates.