The Industry Analysis PowerPoint Template is a collection of 14 business analysis diagrams. Although, these tools facilitate companies to understand their position in competitive market. The industry analysis PowerPoint however enhance the presentation with its high visual impact, statistical effects like charts and infographics. The powerful components of the template create an outstanding business presentation that appeals to the global audience. The PowerPoint is useful as a training guide for employees. The diagrams are operational plans, use to gather facts and implement strategies. As an illustration indicates, this template has wide range of industry analysis diagrams including:
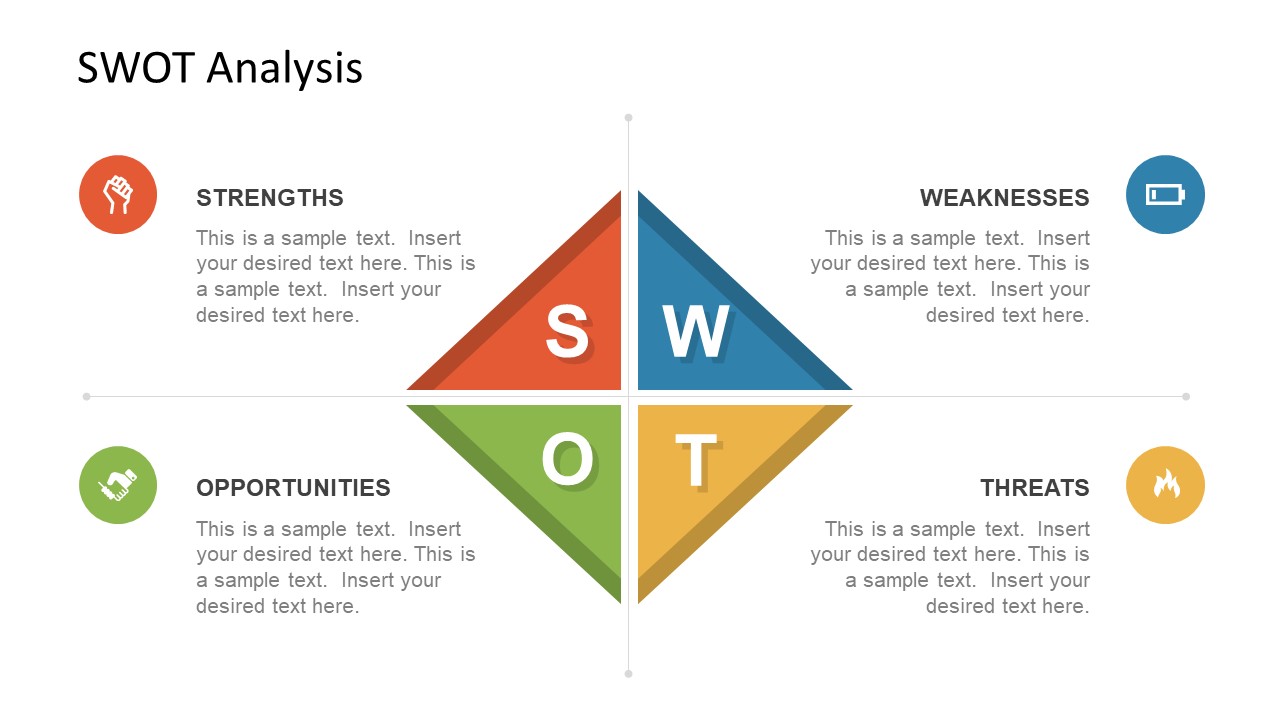
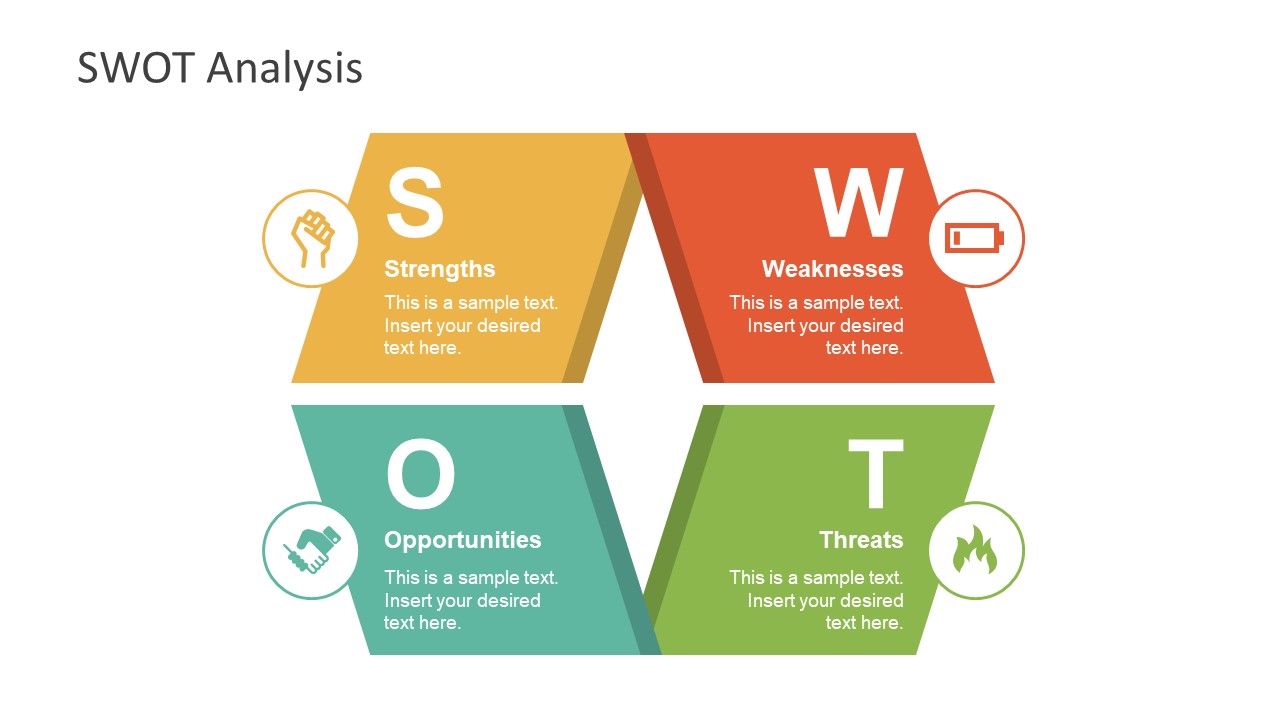
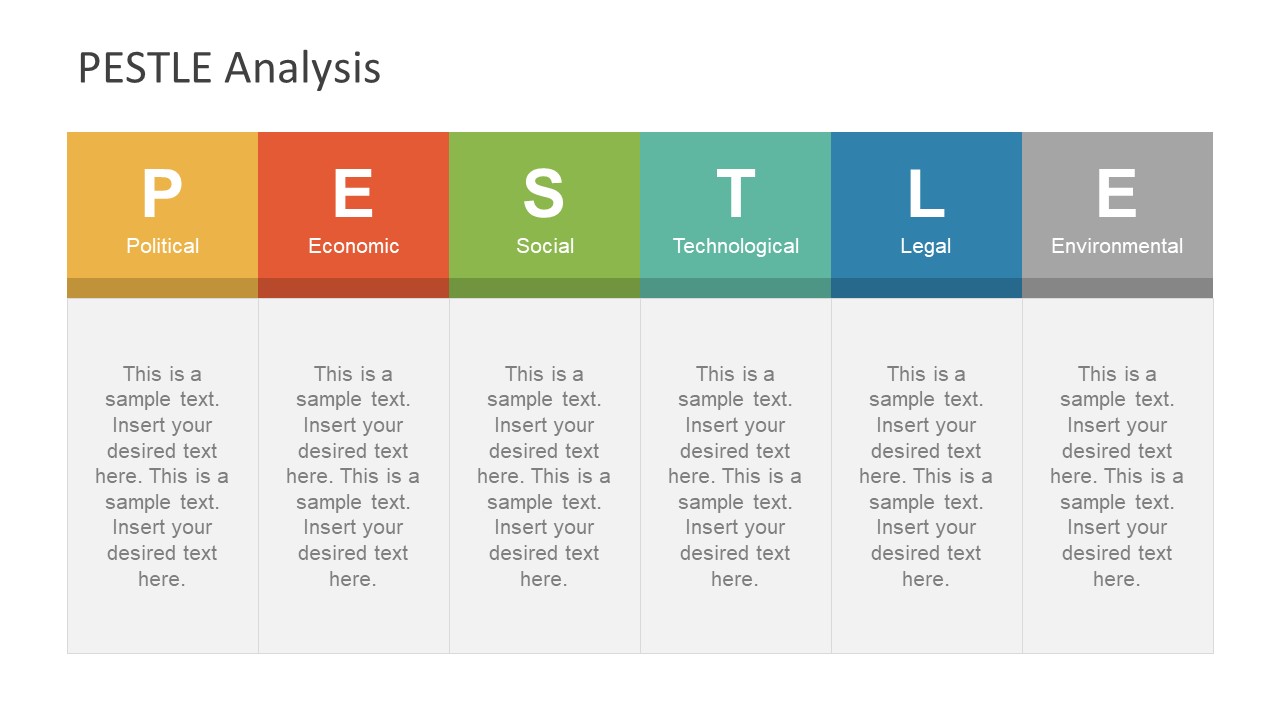
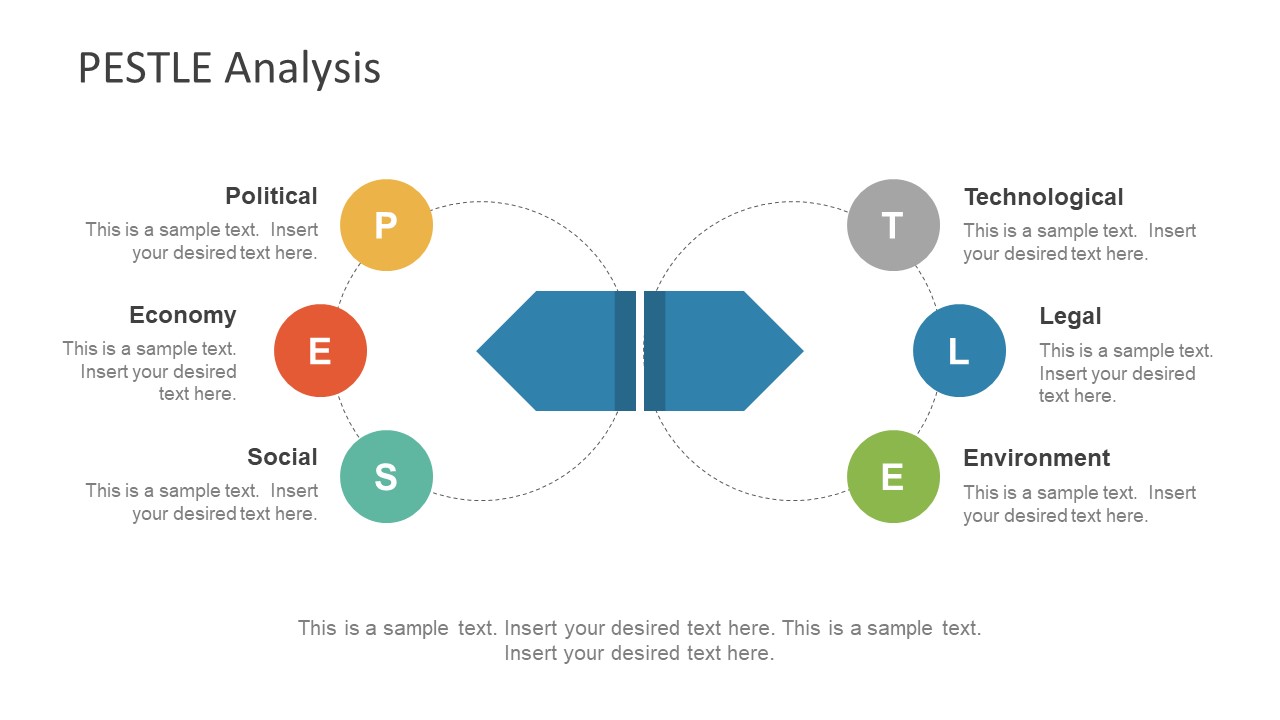
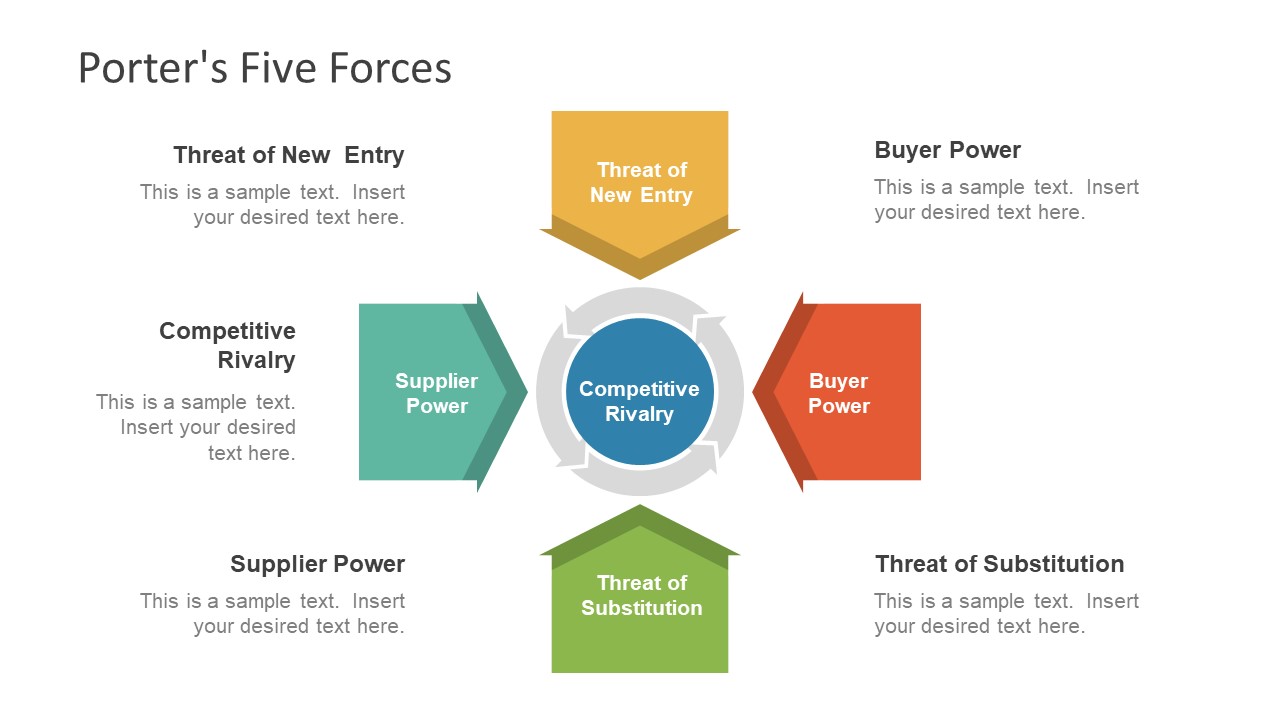
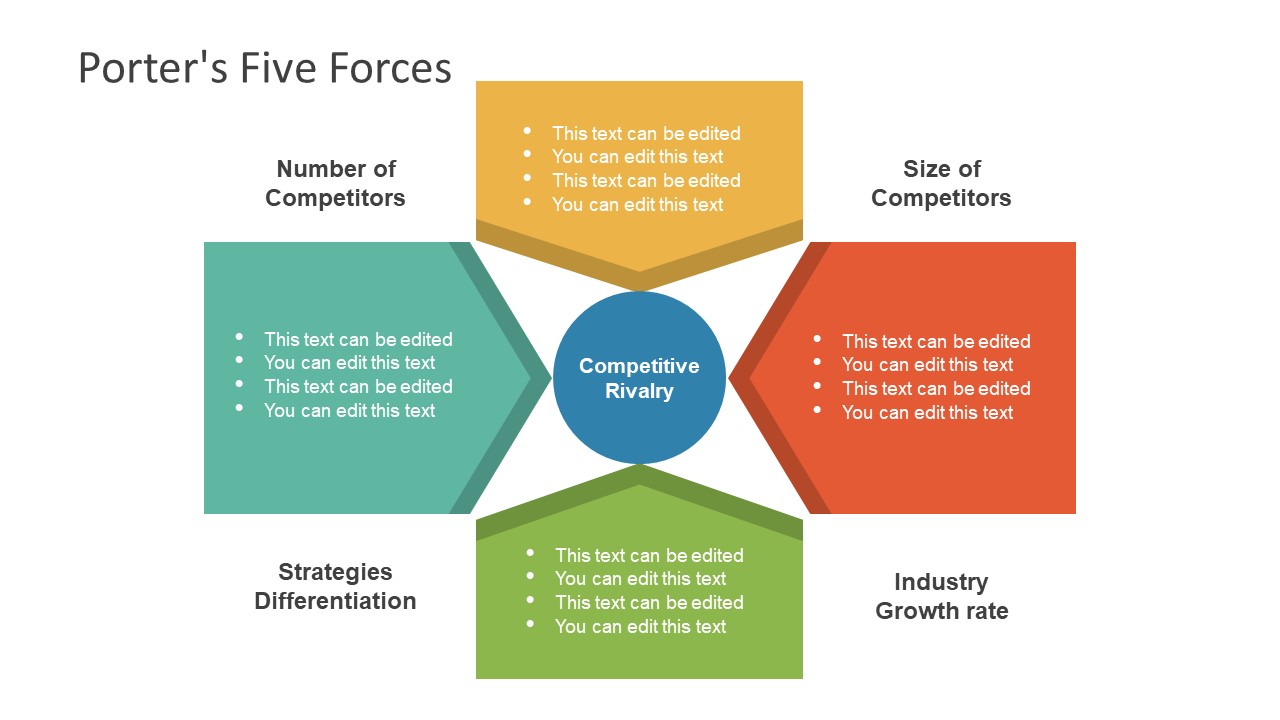
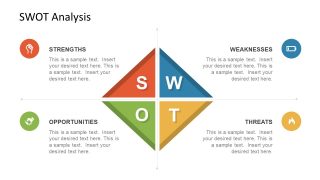
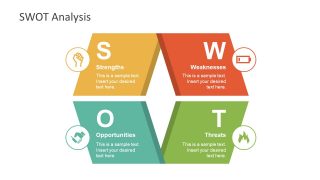
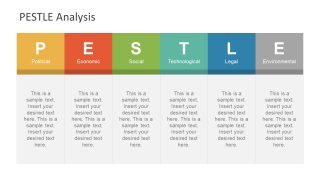
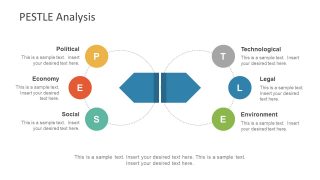
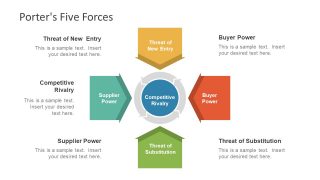
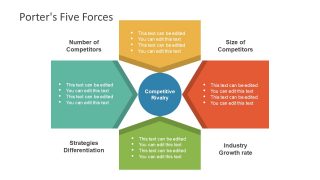
- SWOT Analysis, PESTLE, Porter’s Five Forces and Porter’s Diagram to develop competitive advantage
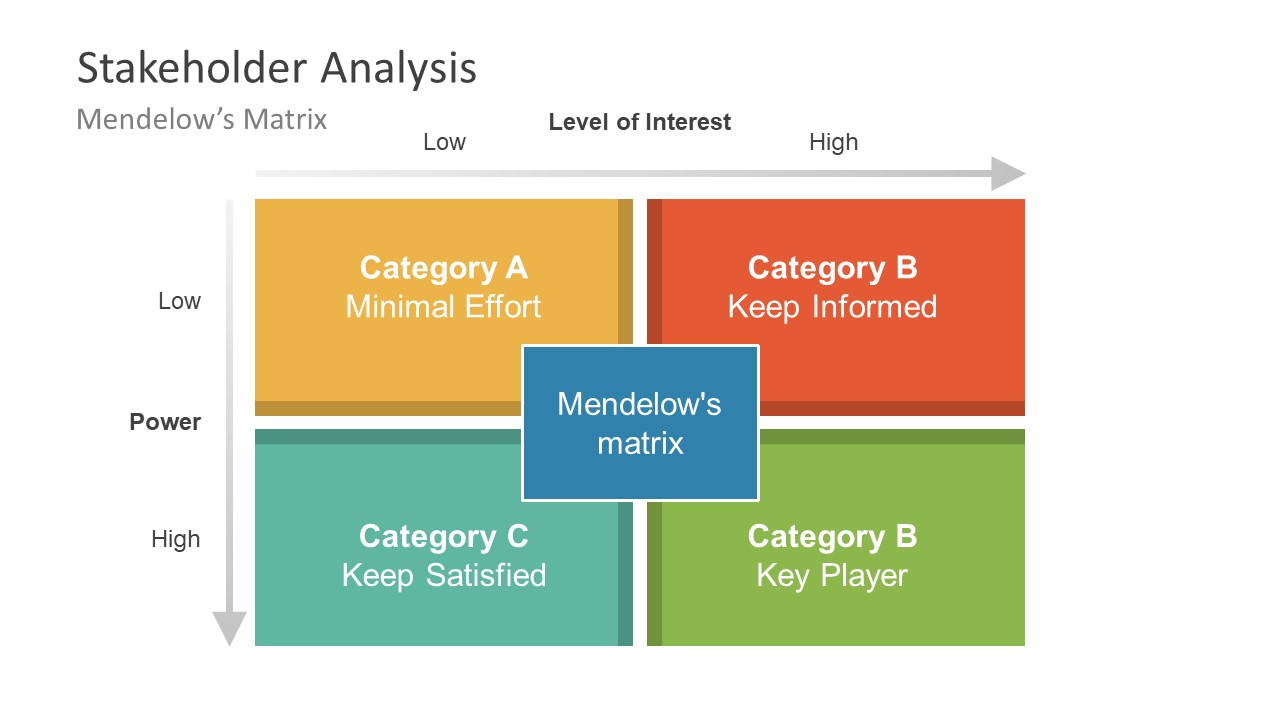
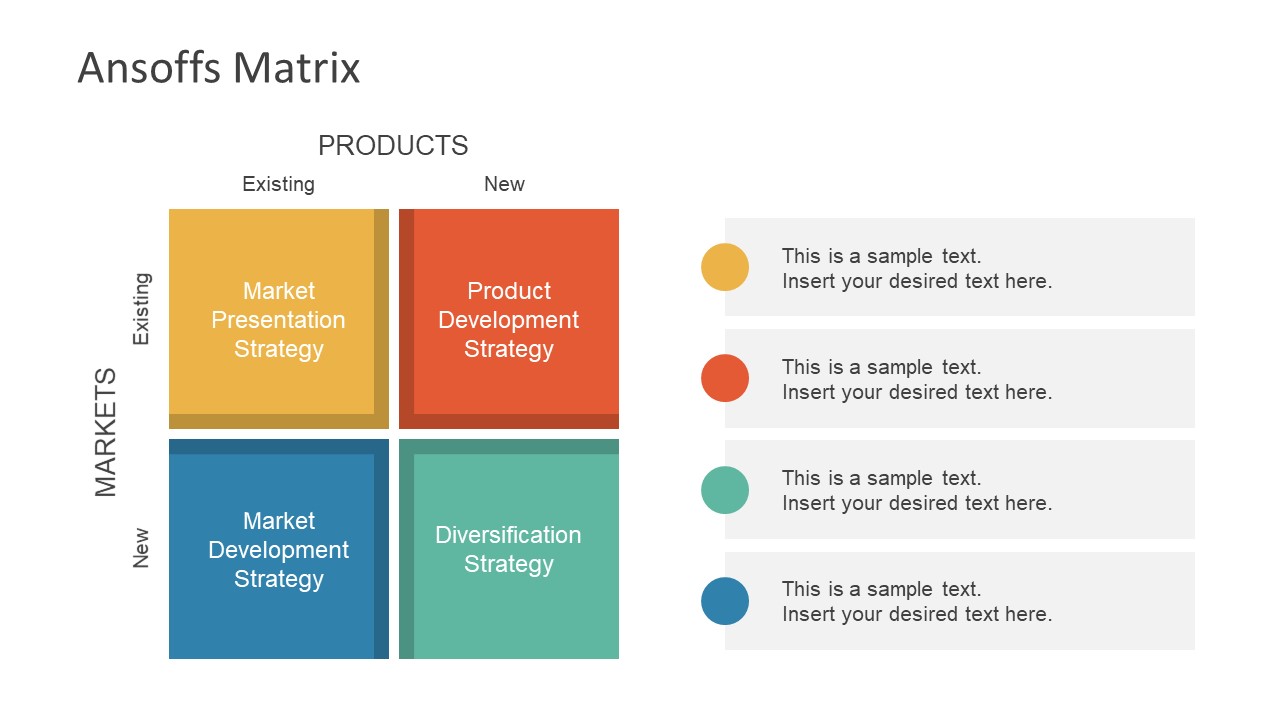
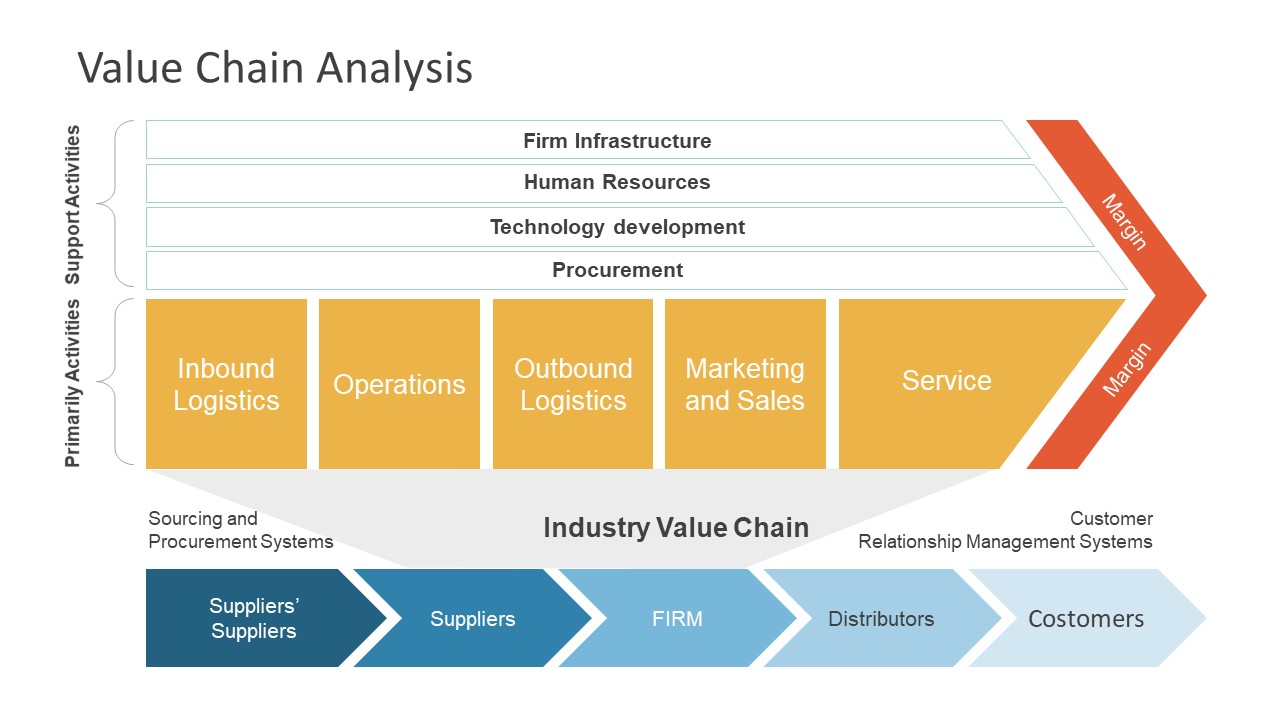
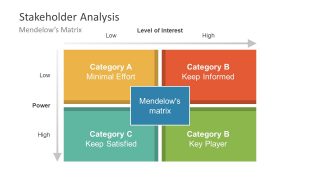
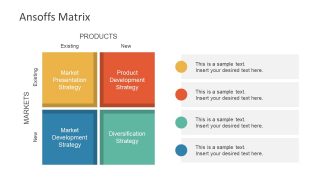
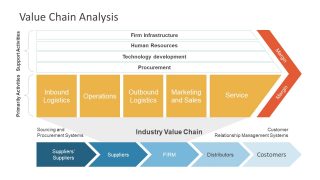
- Management model for specific component, Mendelow’s and Ansoff’s Matix and Value Chain Analysis
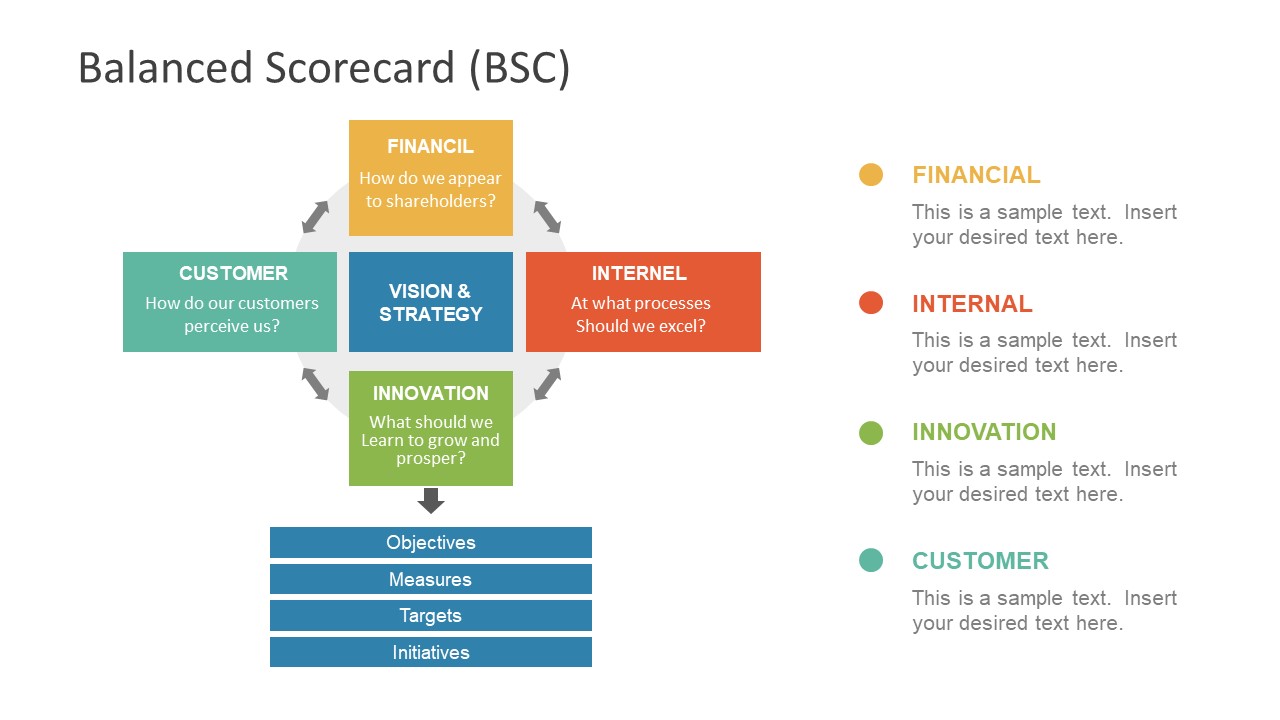
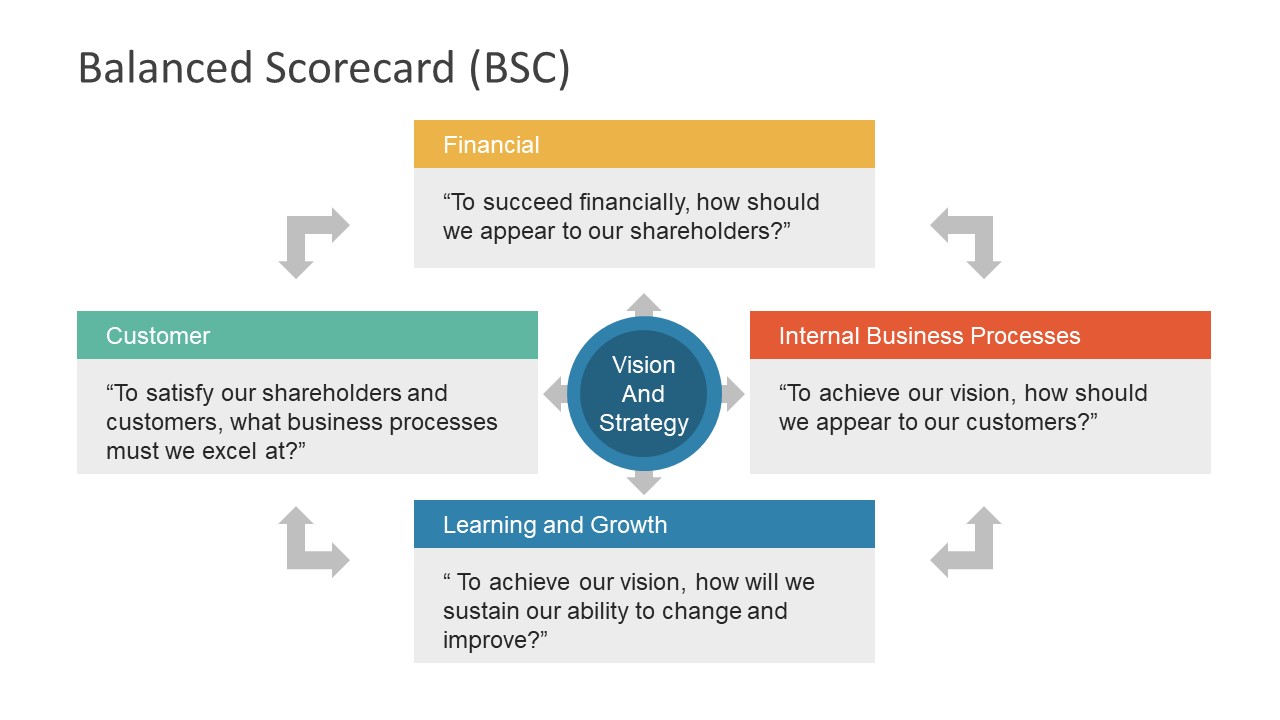
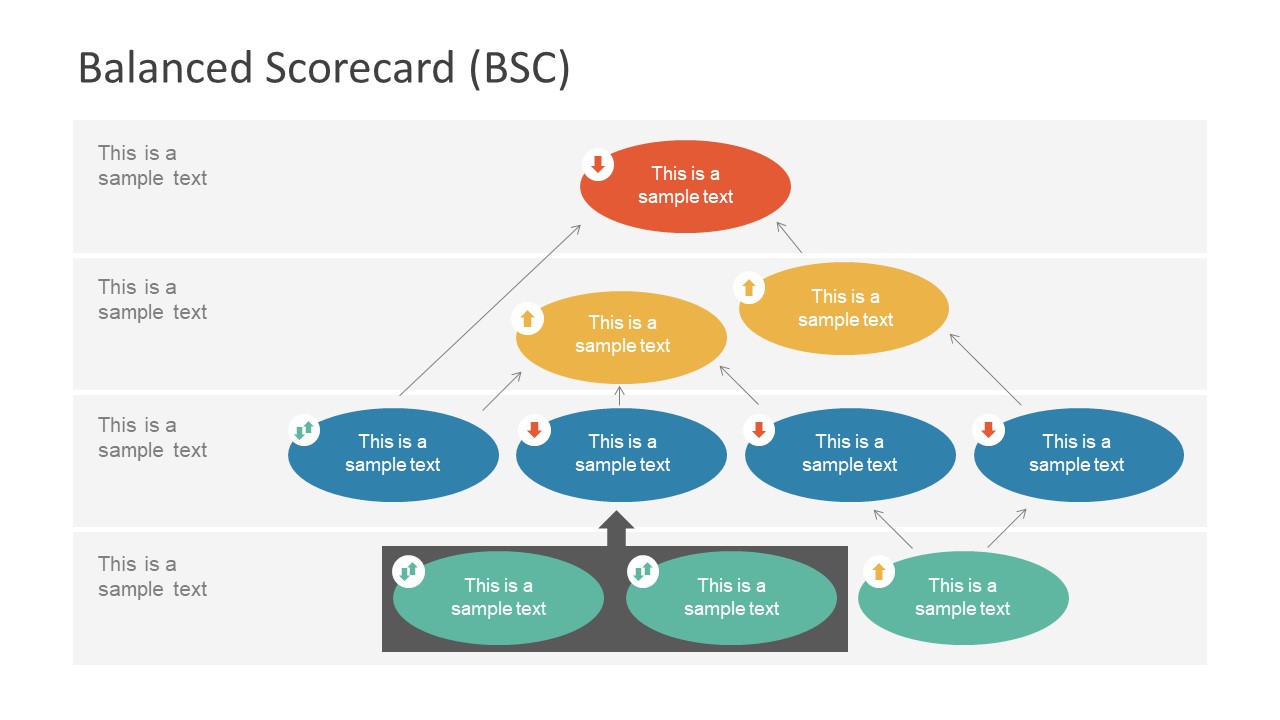
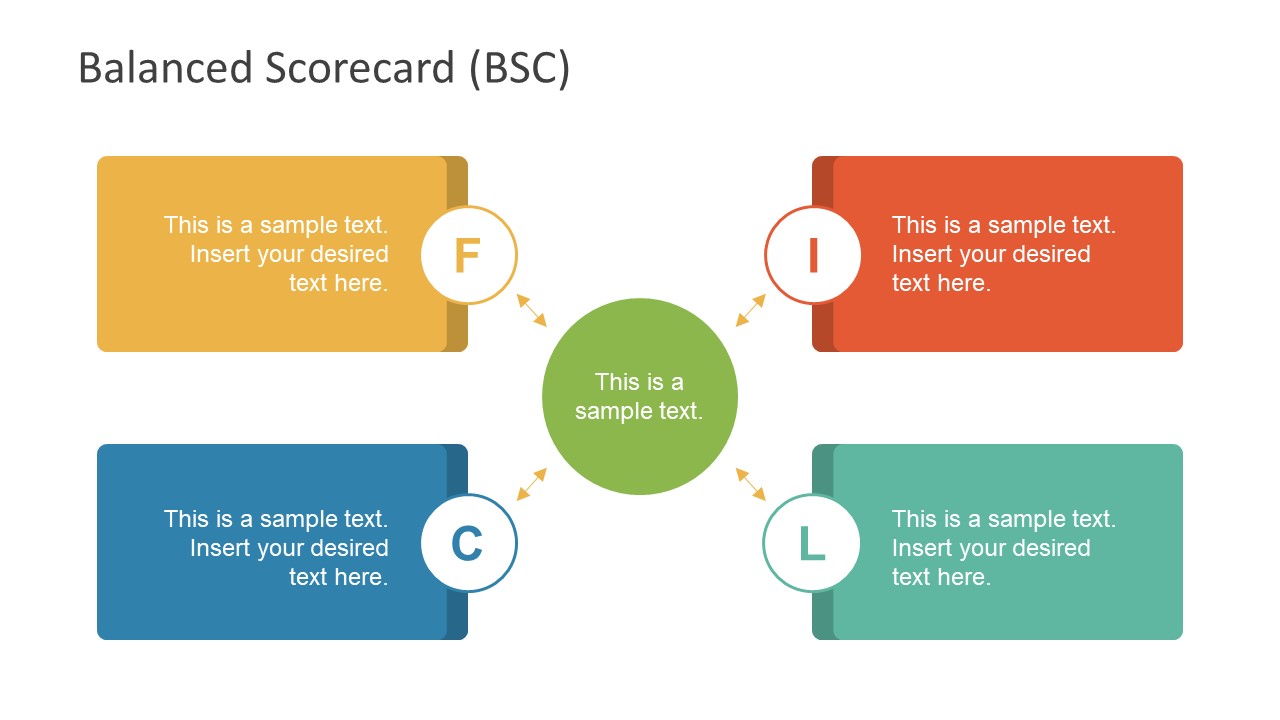
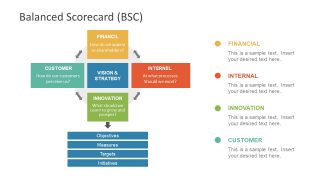
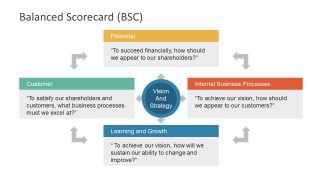
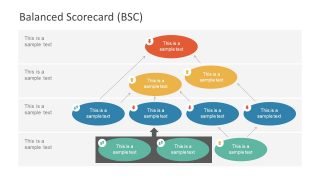
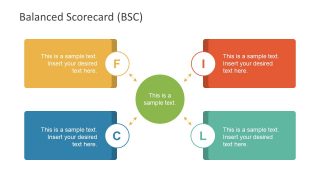
- The Balanced Scorecard is the performance improvement model
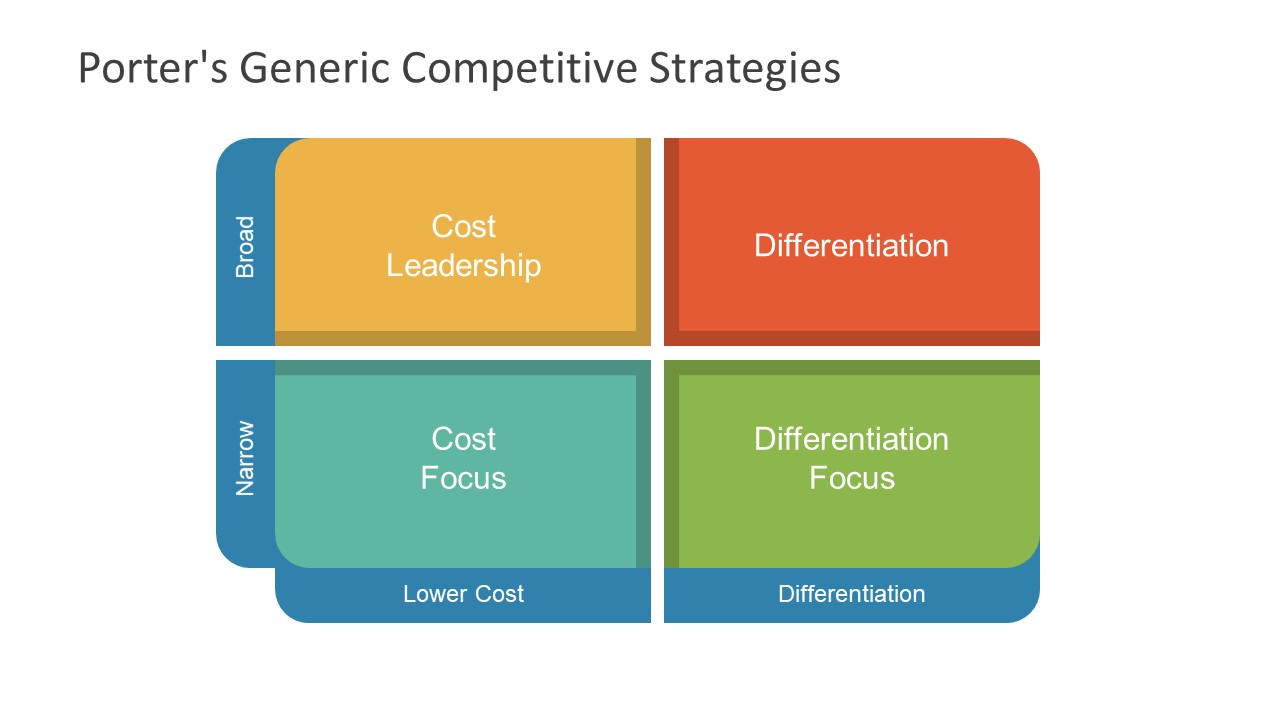
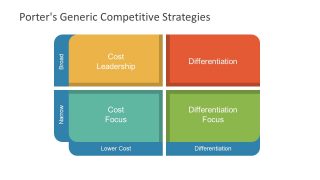
- Porter’s Generic Competitive Strategy to create a challenging market place
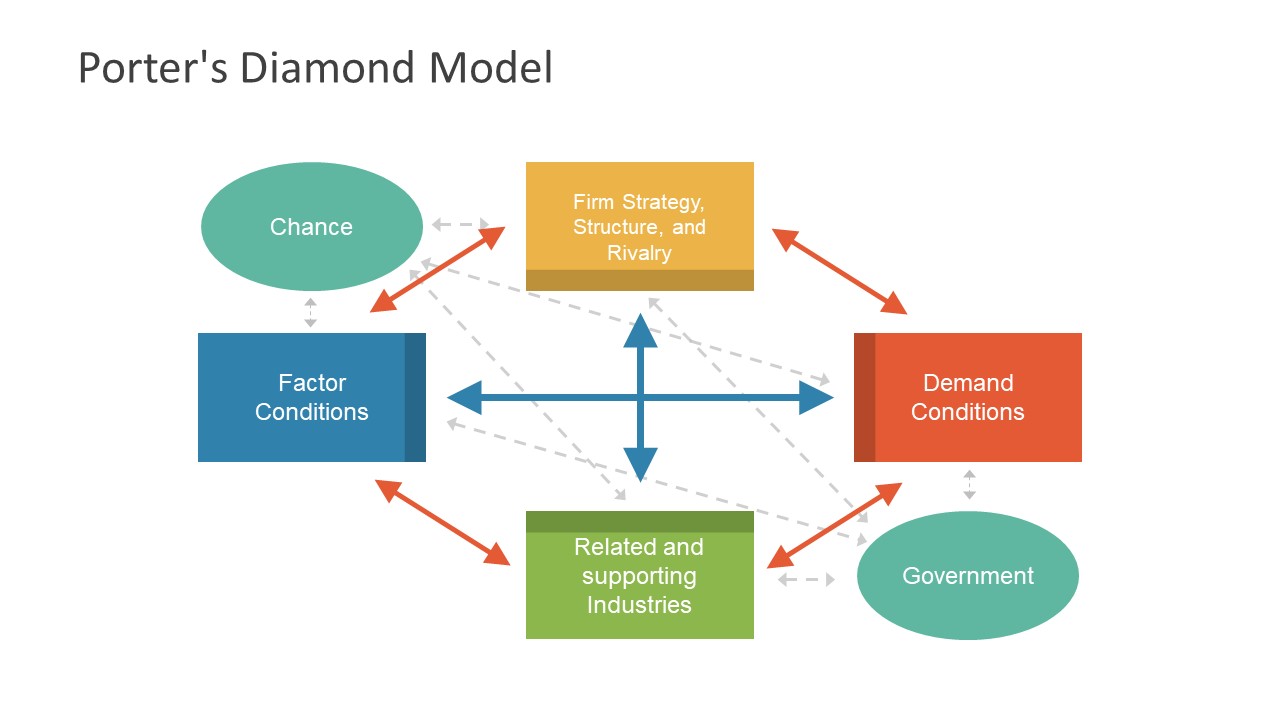
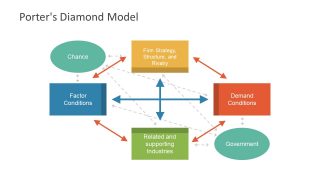
- Porter’s Diamond Model Diagram slide template
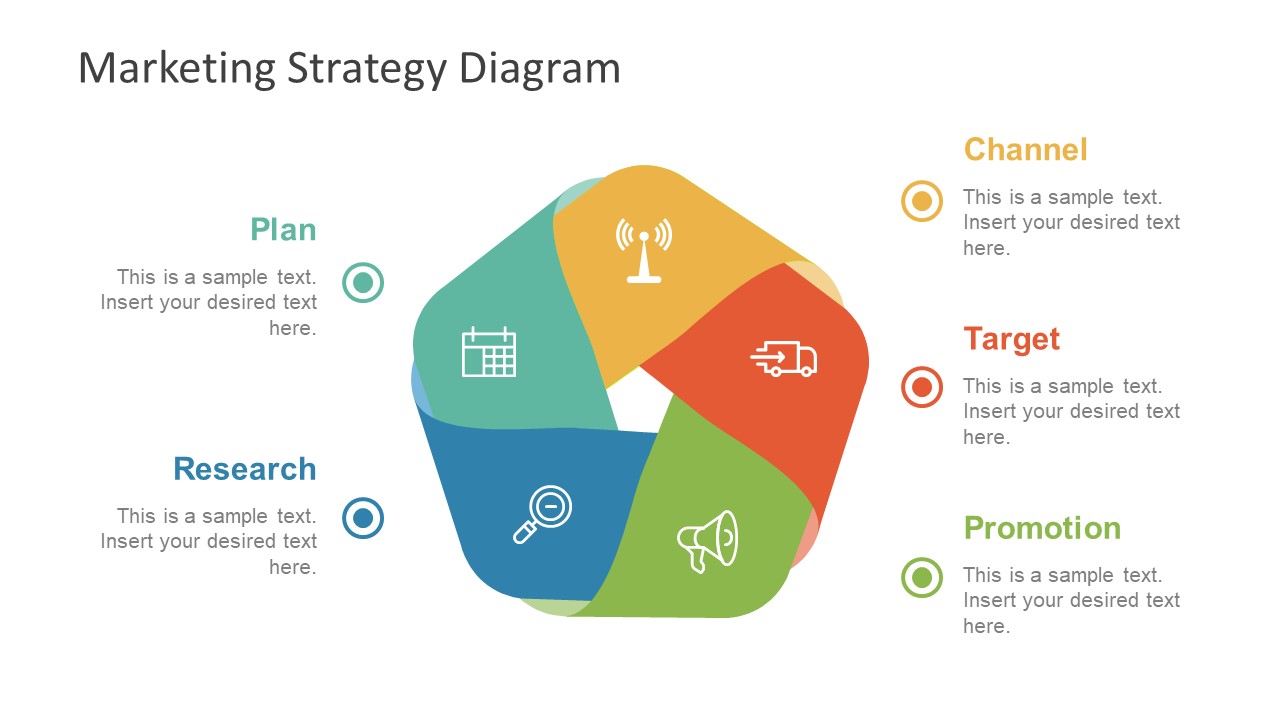
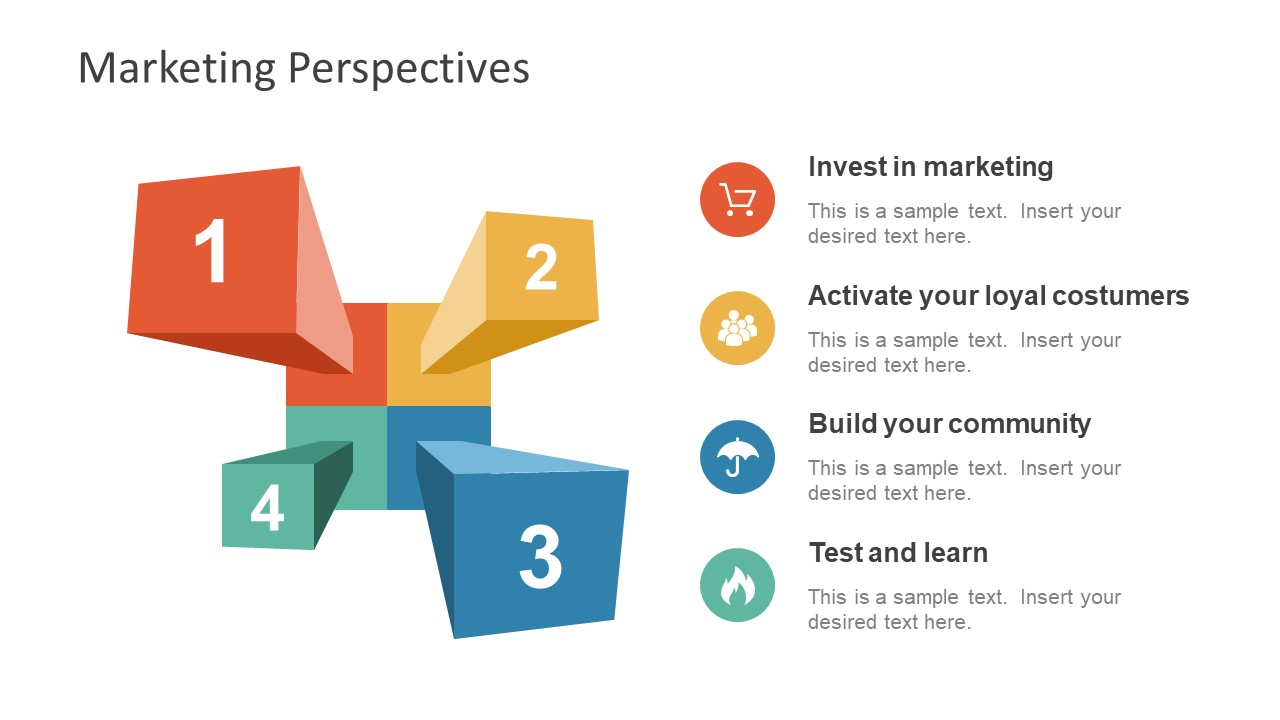
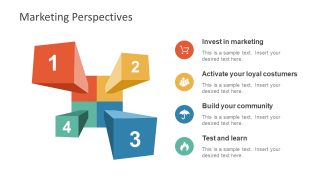
- Comprehensive market planning diagrams, Strategy and Perspective
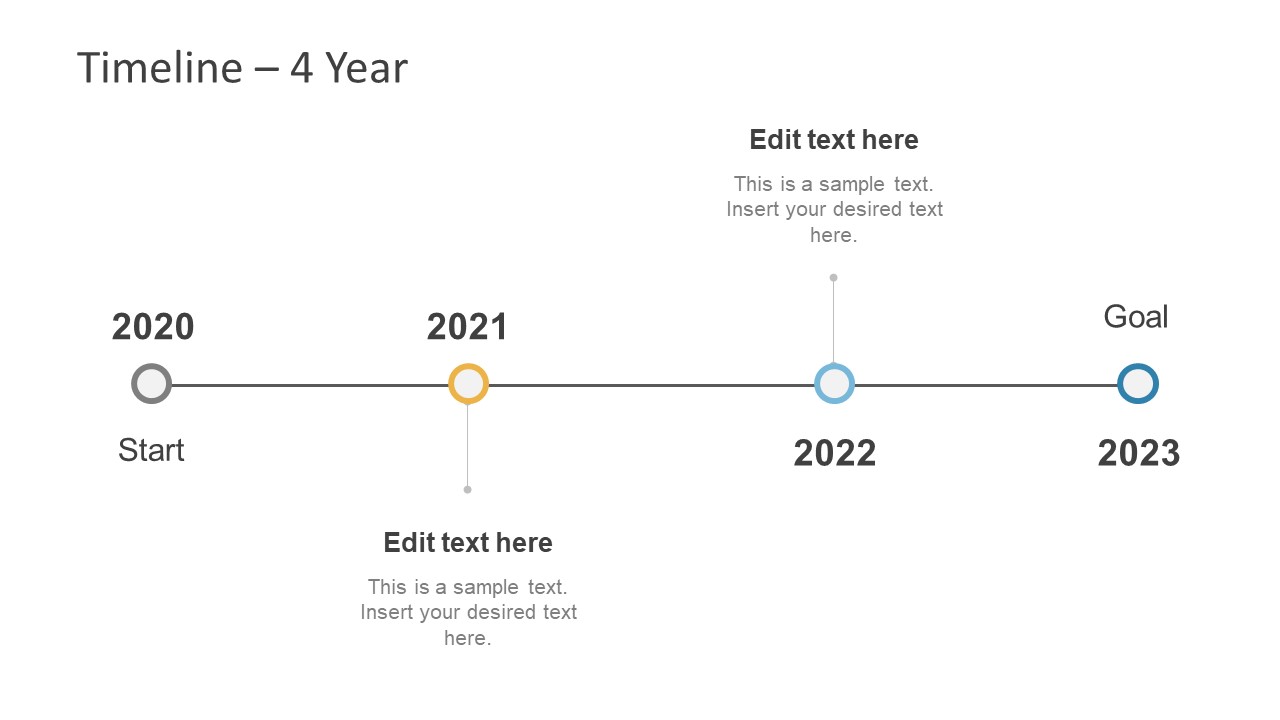
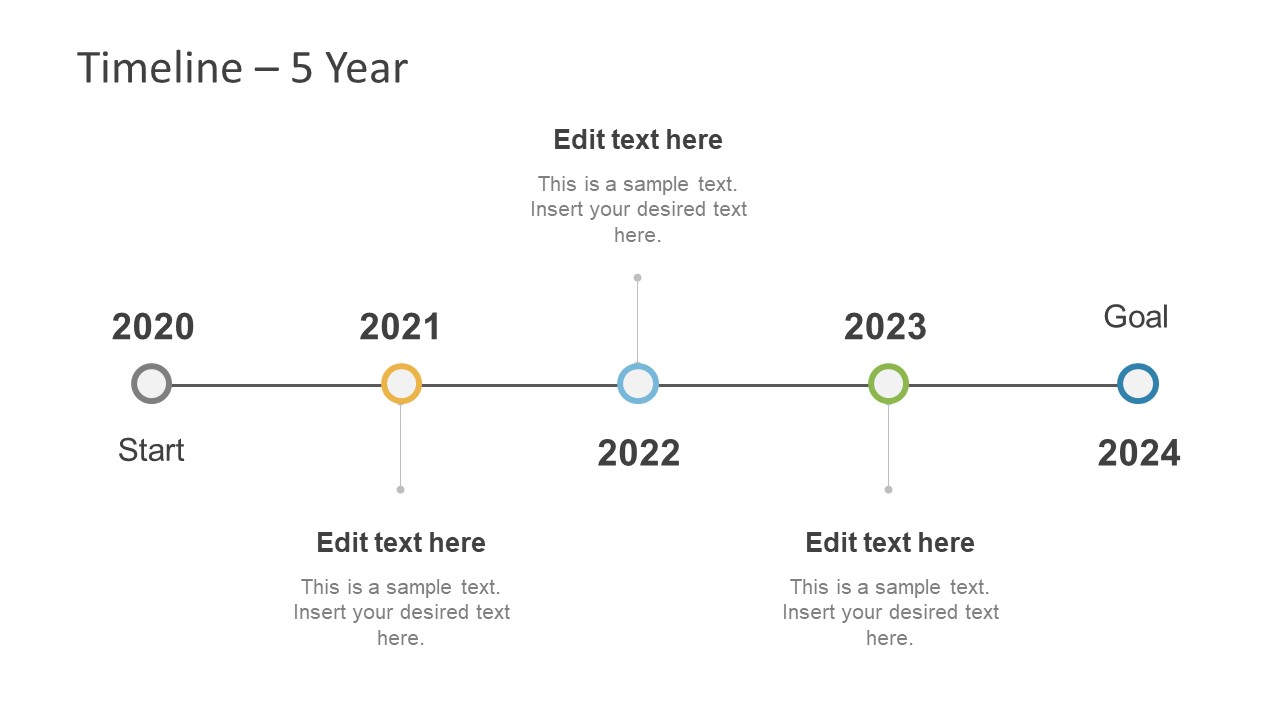
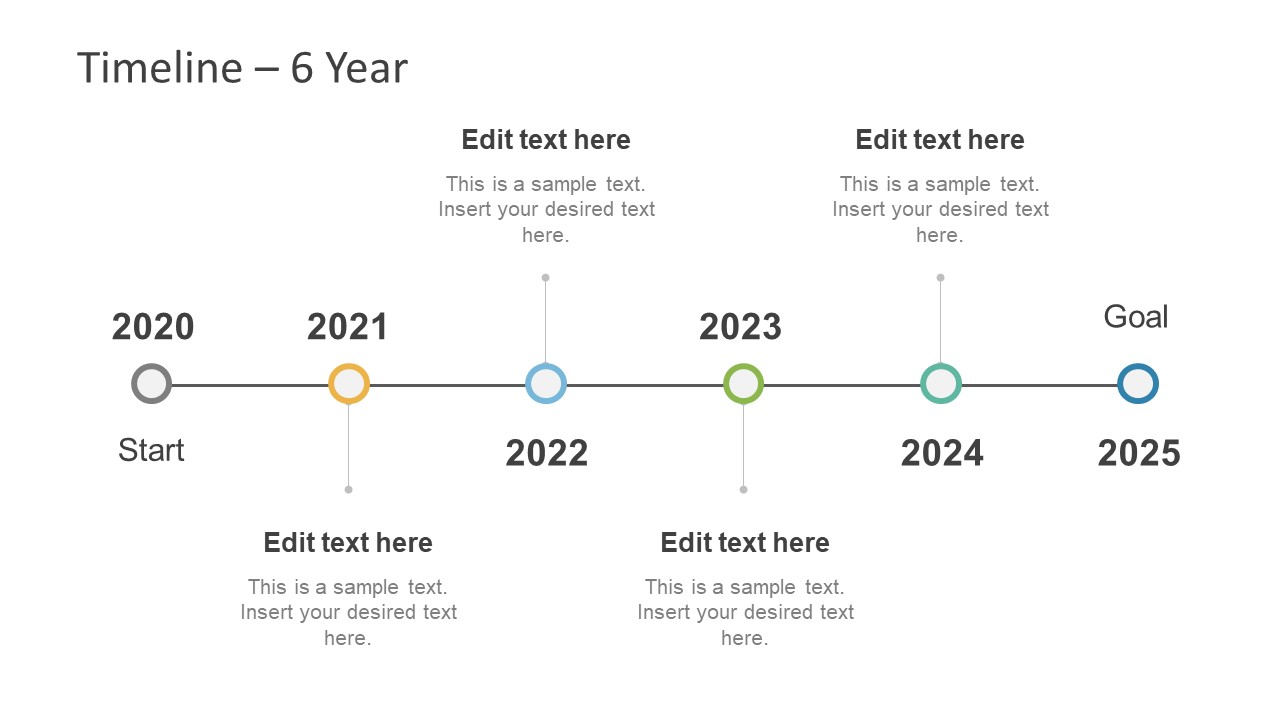
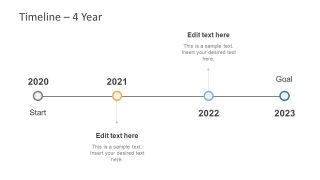
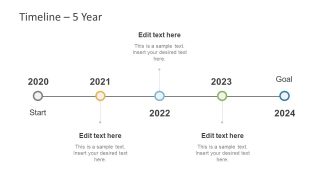
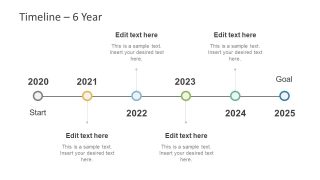
- Timeline design for four, five and six-year planning
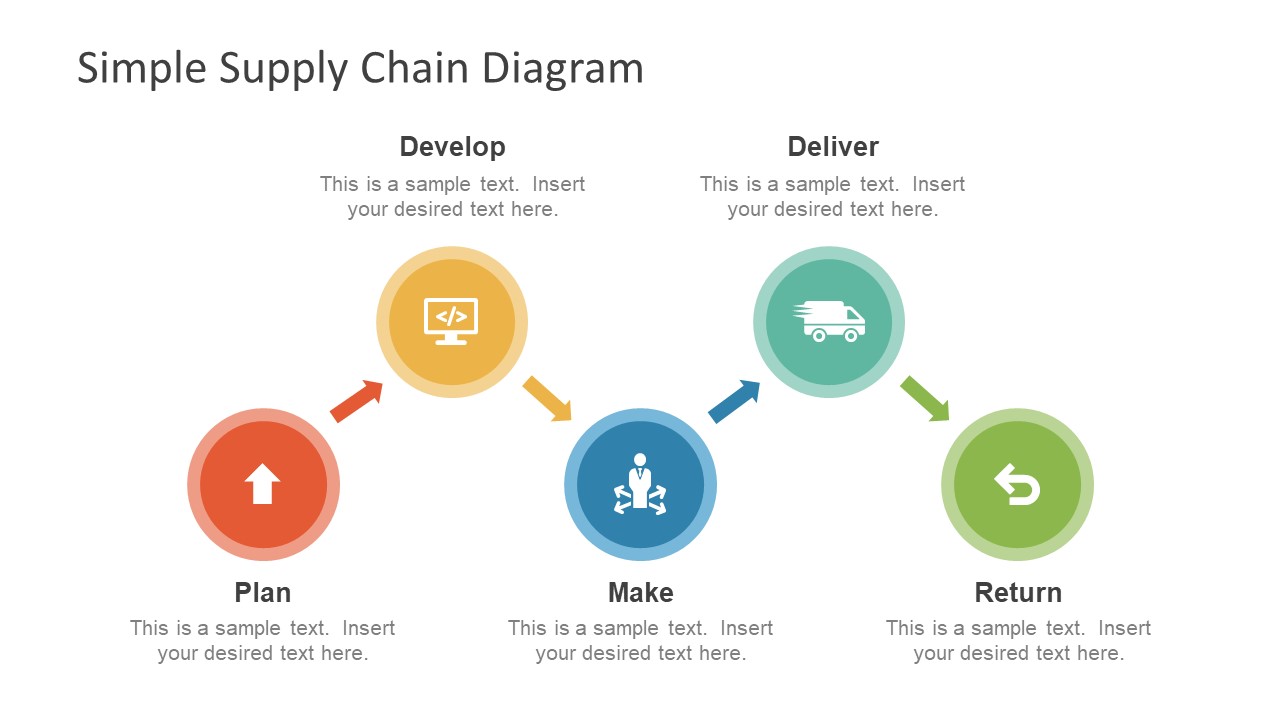
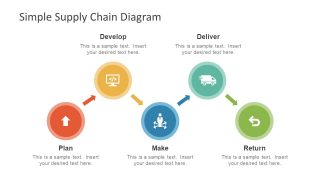
- The Supply Chain basic process model
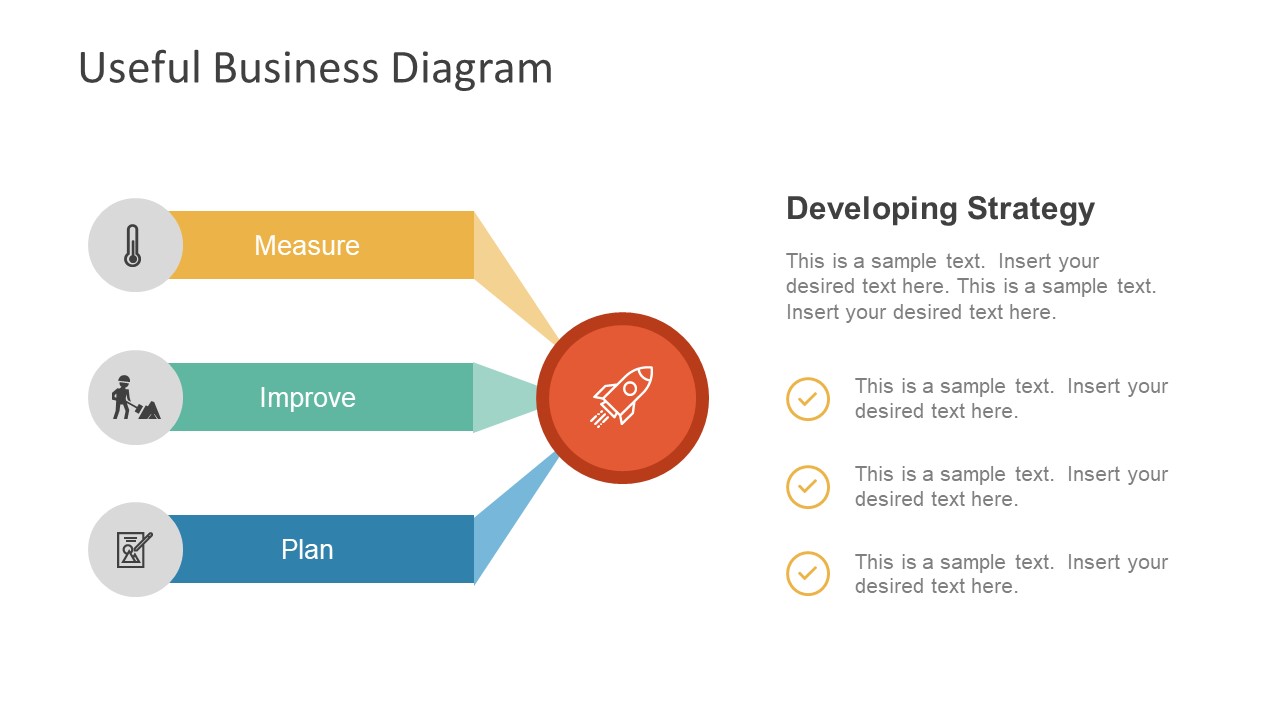
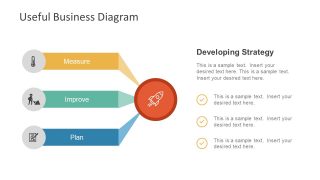
- 3 Step Business Development Strategy
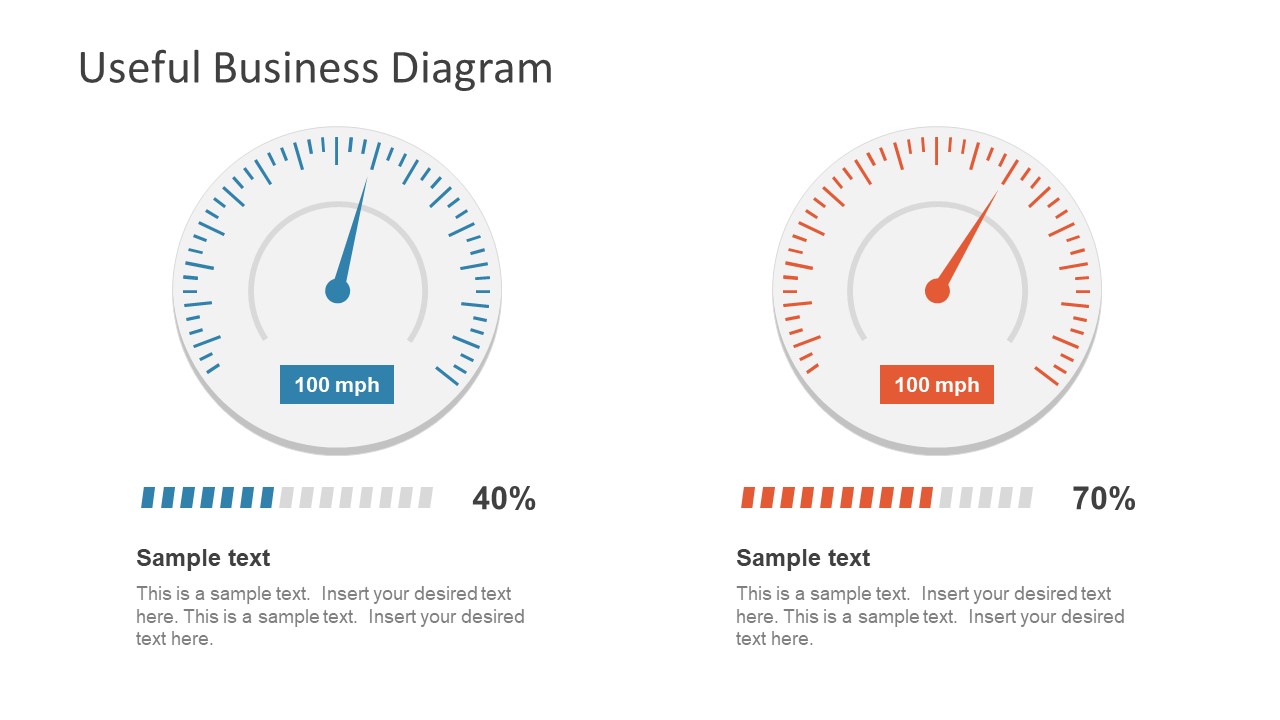
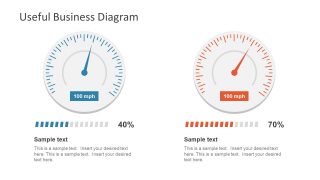
- Speed Meter to rate success
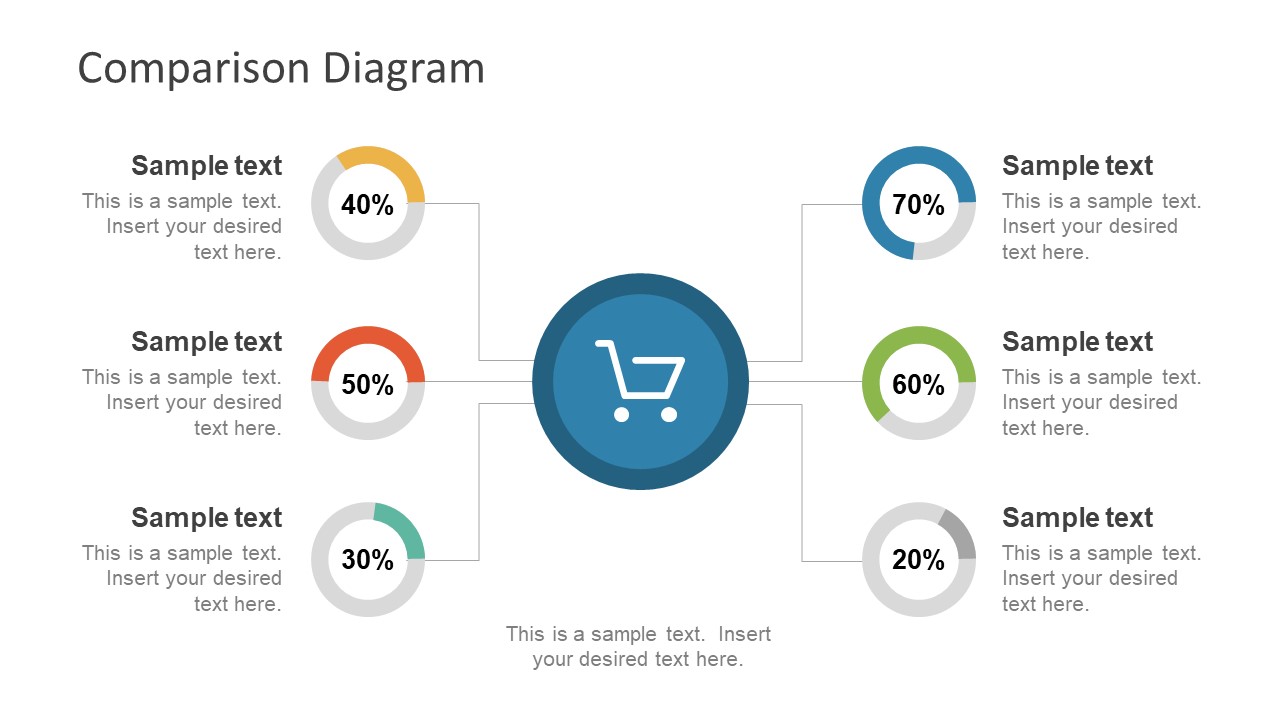
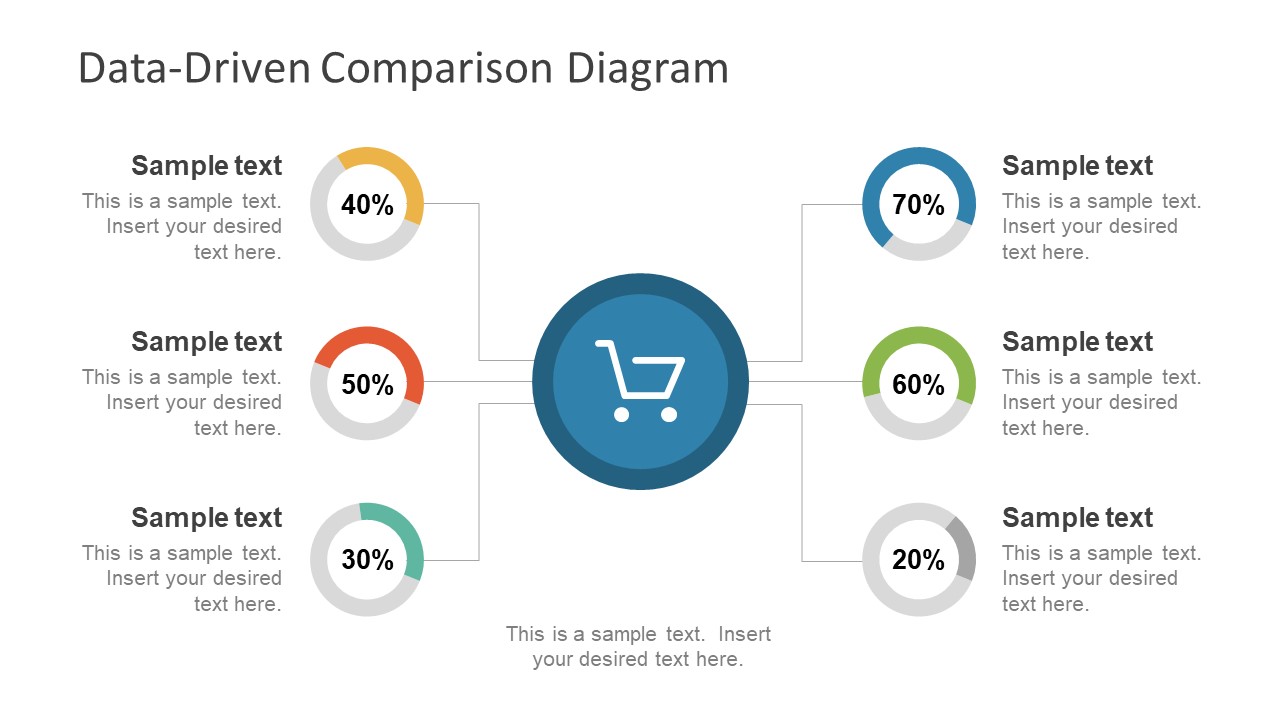
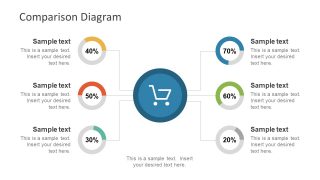
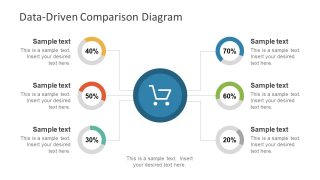
- Data driven Product Comparison Diagram
The Industry Analysis PowerPoint Template is a deck of 25 high-definition editable slides. It contains colorful flat design infographics, chevron, clipart and shapes. Simply copy a necessary slide or diagram in another existing presentation. Moreover, the shapes, charts, icons, color themes and effects are also changeable. For instance, select any doughnut shape chart of PowerPoint in last slide. It gives three customization options of elements, styles and filters. The elements feature includes titles and labels whereas, styles aids in modifying overall appearance. The filter however lets users add values and formulas in spread sheet or import data from excel. The industry analysis template is ideal for MBA students who need quick PowerPoint slides for their numerous presentations. Similarly, the business consultants and analysts can present their research and findings to the executive audience for taking smart decisions.
Alternatively, you can download other industry analysis templates for PowerPoint & Google Slides presentations, like the business industry analysis PPT template.
What’s inside this template
Example presentation scenarios
- A strategy consultant can use the SWOT, PESTLE, and Porter's Five Forces slides to explain an industry landscape and recommend where a client should compete.
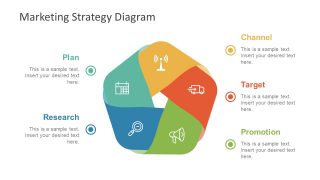
- A marketing manager can use the Marketing Strategy Diagram, Marketing Perspectives slide, and comparison diagrams to align a team around target segments, channels, and promotional priorities.
- An operations leader can use the Value Chain Analysis and Simple Supply Chain Diagram to present process gaps, supplier relationships, and delivery flow to executives.
- An MBA student can use the Ansoff's Matrix, Porter's Diamond Model, and Balanced Scorecard slides to structure a case presentation with familiar business frameworks.
- A leadership team can use the 4-year, 5-year, and 6-year timeline slides to connect market analysis findings to staged strategic initiatives.
Features
- 100% editable presentation template
- Compatible with Microsoft PowerPoint and Google Slides
- 16:9 aspect ratio slides
- Scalable vector shapes, icons and illustrations
- AI-Ready for Microsoft Copilot and Claude
- Instant access and download
Frequently asked questions
Q: How should a presenter structure an industry analysis with this template?
A: Start with an external scan using PESTLE and Porter's Five Forces, then move into company position with SWOT, Ansoff's Matrix, or the value chain. Use the Balanced Scorecard slides to translate findings into objectives, then close with a timeline or comparison diagram so the audience sees practical next steps.
Q: Who is this template best suited for in a business presentation?
A: This template fits consultants, analysts, marketing leaders, and MBA presenters who need to explain how a market works, where a company stands, and which strategic choices matter. The mix of stakeholder matrix, competitive strategy, value chain, and supply chain slides makes it useful for executive discussion rather than only classroom theory.
Q: Why does the template use so many matrix and model-based diagrams?
A: Industry analysis often fails when ideas are listed without structure. Matrix layouts such as SWOT, Ansoff's Matrix, Mendelow's Matrix, and Porter's Generic Strategies force clear tradeoffs. Circular and connected diagrams, such as the Diamond Model and supply chain flow, help audiences see cause-and-effect relationships instead of isolated observations.
Industry Analysis PowerPoint Template
25-slide industry analysis presentation template with SWOT, PESTLE, Porter models, timelines, and strategy diagrams
The Industry Analysis PowerPoint Template is a 25-slide business analysis deck for Microsoft PowerPoint and Google Slides. It includes SWOT, PESTLE, Porter's Five Forces, Balanced Scorecard, value chain, stakeholder matrix, timelines, supply chain, speedometer gauges, and comparison diagrams for consultants, analysts, MBA students, and strategy teams.
- Category
- Business PowerPoint Templates
- Rating


 Loading...
- Aspect ratio
- 16:9, 4:3
- Item ID
- 7513-01
- Colors
 Microsoft PowerPoint
  Microsoft Copilot
  Claude for PowerPoint
 Other formats supported
Subscribe today and get immediate
access to download our PowerPoint templates.