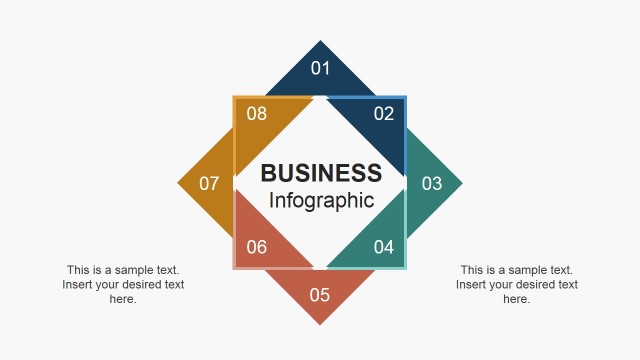
Business Analysis Infographic Shapes
The Business Analysis Infographic Shapes PowerPoint is an amazing set of modern design diagram for reporting purposes. However, the students of business, research and development related fields can also use this PowerPoint. The unique and creative visual of graphics help engage audience. Whereas, the structure process flow enables them to understand the logic of concept quickly and better than textual content. This PowerPoint is an outstanding tool for presenting innovation in business analysis strategies. It saves time to simply add data values and text in pre-design PowerPoint shapes rather than creating from scratch.
The Business Analysis Infographic Shapes are the flat design vector PowerPoint diagram and figures. The eight-slide template includes timeline, roadmap, data flow, circular process flow, activity, performance report, and progress. These templates are useable in other presentations if necessary. For instance, a PowerPoint of KPI can become interactive with the use of performance reports. Also, discuss a 6-step business concept using circular flow process diagram. The slide of roadmap with rocket icon represents success using many cool infographics. Similarly, using magnifying glass image, stop watch, speech bubble and mountain peaks make the PowerPoint visually interactive.
The PowerPoint shapes of Business Analysis are fully editable vector infographics. The visual properties of the template are easily customizable. For example, changing the colors of desire objects from format drawing menu. Moreover, resizing, duplicating, replacing or moving the figures by simple mouse clicks. Further, add shapes effects like present, shadow, 3D and reflection, like the last slide of bar chart. Add text in placeholders, change the font properties or add more text fields by adding textbox. These business diagram templates are useful in determining the scope, stages and progress evaluation of a project. The template can help in various presentations like project life cycle, walk through models and process flow.


