Slide 3 of 8 from Business Analysis Infographic Shapes
Roadmap to Success Diagram PPT
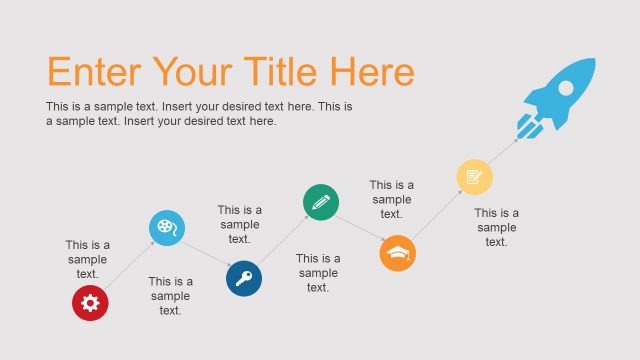
Business Analysis Process Flow Slide
- Diagram
- Arrow Sequence
- Process Slide
- 16:9
- 100% Editable
What’s on This Slide
The layout features a horizontal process flow with five circular nodes connected by arrows. The first node is positioned on the left, followed by four equally spaced nodes extending to the right. Each node contains an icon representing a distinct step, with text placeholders below each icon for descriptions. The title is prominently displayed at the top center in a large font, while a subtitle is positioned directly beneath it. The background is a light gray, providing contrast to the colorful nodes, which use a palette of blue, green, orange, and red. The overall composition is clean and organized, emphasizing the flow of steps.
How to Use It
This layout serves as a visual representation of a sequential process, ideal for illustrating steps in a business analysis or project lifecycle. It fits well in presentations that require clarity in process explanation, such as project planning or workflow discussions. This slide can be used to outline methodologies, stages of development, or phases of a project. It is effective for both team meetings and client presentations, where a clear understanding of the process is essential.
Text Placeholders & Capacity
Keep your copy within these limits so it fits without resizing. Node text slots can hold about 10 words each.
| Placeholder | Count | Max characters (approx.) |
|---|---|---|
| Slide title | 1 | 30 |
| Item body | 5 | 50 |
Slide Keywords
Download unlimited PowerPoint templates, charts and graphics for your presentations with our annual plan.
DOWNLOADReturn to Business Analysis Infographic Shapes.