Building Occupancy Infographic for PowerPoint is often used by engineers and industry marketers in a building project planning. This is the key point to consider and understand occupancy classification and load factor at the beginning of the project. The load factor will help you determine the number of people that will be using each floor area and the maximum number that can occupy the space.
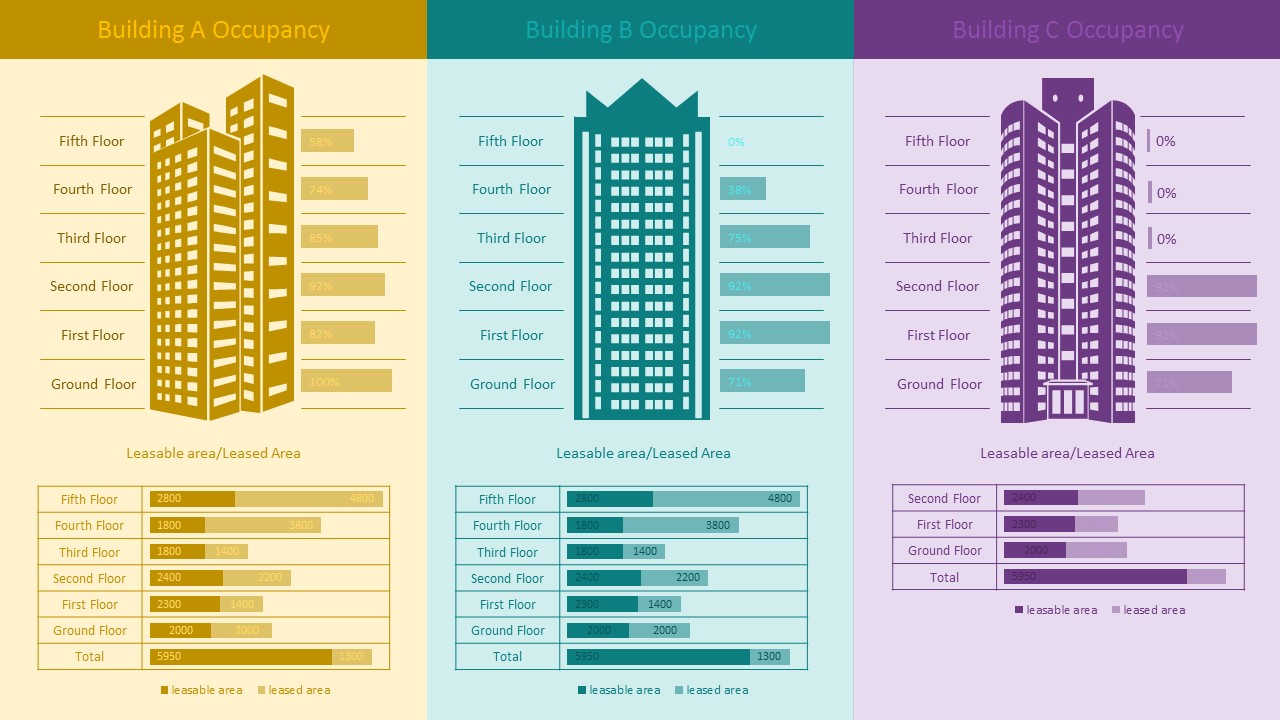
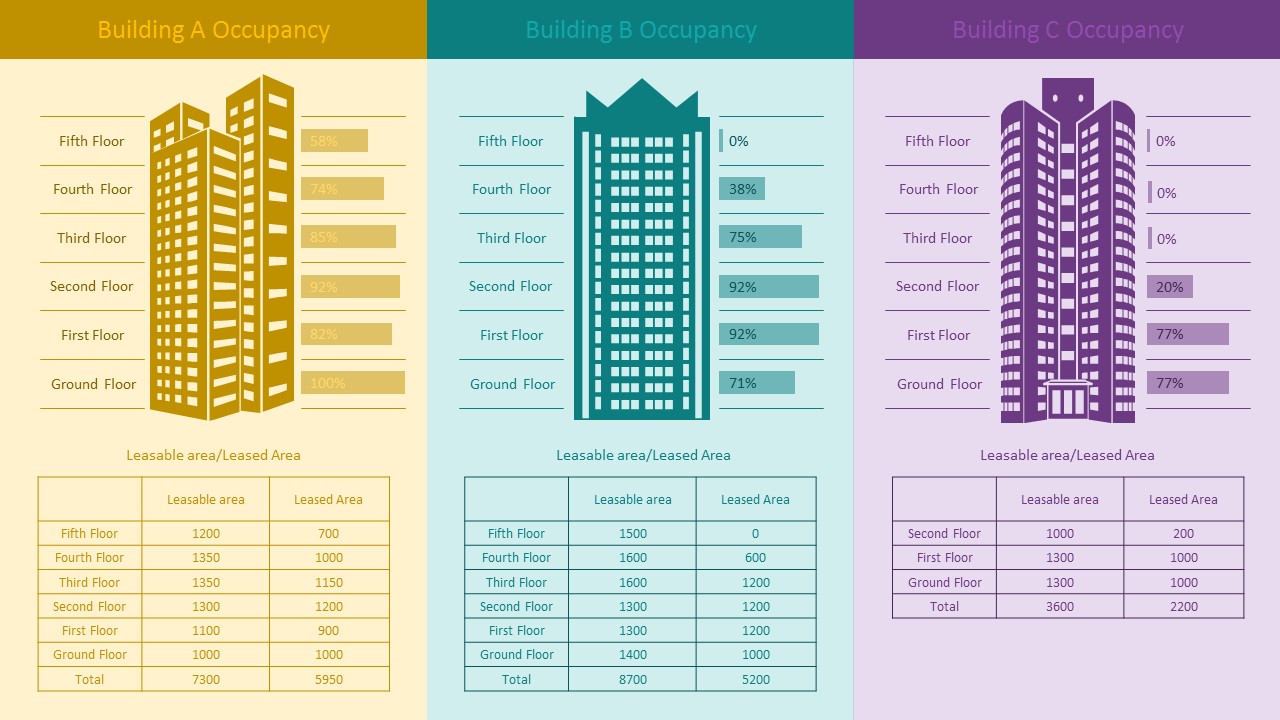
This PowerPoint templates is composed of 2 slides. Each slide has 3 building occupancy infographics, Building A Occupancy, Building B Occupancy, Building C Occupancy. The infographics are divided into sections: ground floor, 1st floor, 2nd floor, 3rd floor, 4th floor and 5th floor. Infographics are in flat gold, green and purple color scheme but these are also customizable to match your PowerPoint presentations preference. Alongside are text fields where you can input occupancy percentage and figures.
At the bottom of the PowerPoint slides are bar graph chart illustrations. These are data driven showing leasable area, leased area percentage and number data. This Building Occupancy PowerPoint templates is designed not only for engineers and architects but for brokers, industry marketers and sales person to easily present occupancy information to clients.
Use this Building Occupancy Infographic for PowerPoint to effectively highlight the occupancy classification and the occupancy load for your presentation for both client and building project standard report. It sets the minimum number of occupants and the occupancy size allowed for which you must design the means of egress from a building or specific area.
Alternatively, we have designed other building diagrams and construction workflow layout. See more PowerPoint templates made available for you and save hours of your time.
What’s inside this template
Example presentation scenarios
- An architect can use the three building panels to explain occupancy classification and floor distribution during an early building planning review.
- A real estate broker can present leased area versus leasable area tables to compare Building A, Building B, and Building C for a client meeting.
- A facilities manager can use the floor-level percentage bars to report which floors are nearing capacity and which floors have available space.
- An engineering consultant can use the building silhouettes and area comparisons to support egress, load, or occupancy planning discussions.
Features
- 100% editable presentation template
- Compatible with Microsoft PowerPoint and Google Slides
- 16:9 aspect ratio slides
- Scalable vector shapes, icons and illustrations
- AI-Ready for Microsoft Copilot and Claude
- Instant access and download
Frequently asked questions
Q: How should a presenter explain the occupancy data without overloading the audience?
A: Start with the three building panels as the main comparison, then move from top occupancy bars to the lower area tables. Call out only the floors with the largest occupancy differences or the most unused leasable area. This keeps the audience focused on space utilization patterns rather than every row of data.
Q: Who is this template best suited for in a project or client meeting?
A: This template fits presenters who need to translate building usage numbers into a visual comparison. Architects, engineers, brokers, and facilities teams can use it when discussing occupancy load, leased area, available space, or planning assumptions with clients who may not want to read dense spreadsheets.
Q: Why does the side-by-side building metaphor work for occupancy reporting?
A: The building silhouettes give the numbers a physical reference, so each floor-level bar feels tied to a real space. Placing Building A, Building B, and Building C in parallel columns makes comparison faster, while the bottom tables separate detailed area figures from the high-level occupancy story.
Building Occupancy Infographic for PowerPoint
2-slide presentation template for building occupancy infographics with floor bars and leasable area tables
Building Occupancy Infographic for PowerPoint is a 2-slide data-driven presentation template for reporting building occupancy by floor. It shows three building panels, floor-level occupancy bars, leasable area tables, and leased area comparisons for Building A, Building B, and Building C. It is designed for architects, engineers, brokers, and planners using PowerPoint or Google Slides.
- Category
- Business PowerPoint Templates
- Rating


 Loading...
- Aspect ratio
- 16:9, 4:3
- Item ID
- 0044
- Colors
 Microsoft PowerPoint
  Microsoft Copilot
  Claude for PowerPoint
 Other formats supported
Subscribe today and get immediate
access to download our PowerPoint templates.