Balanced Scorecard PowerPoint Template
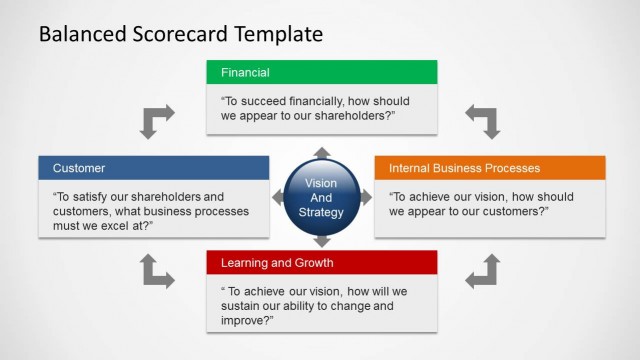
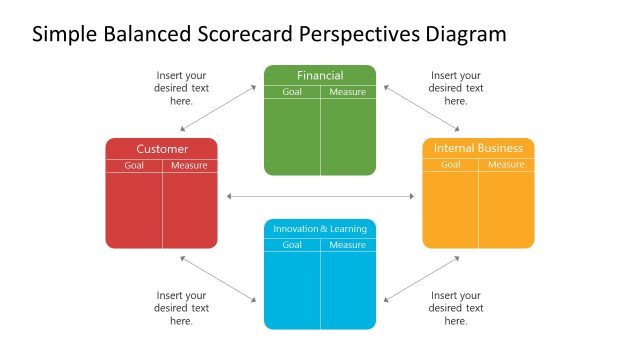
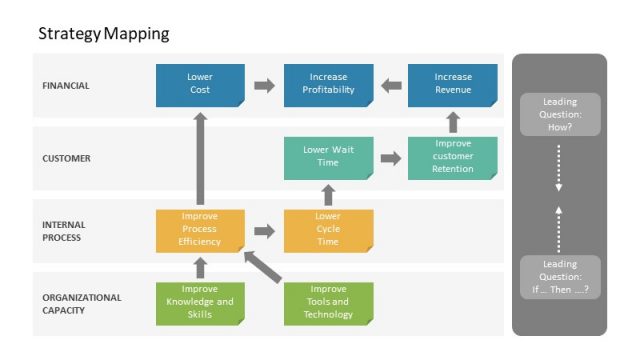
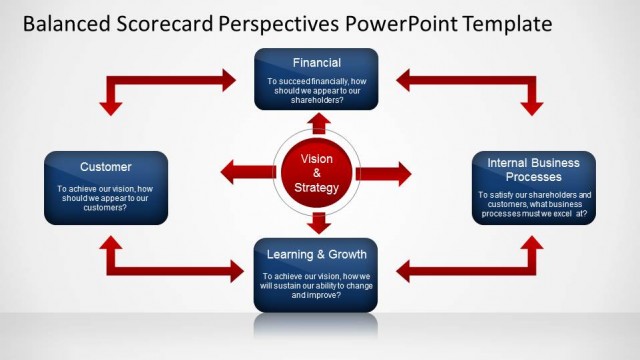
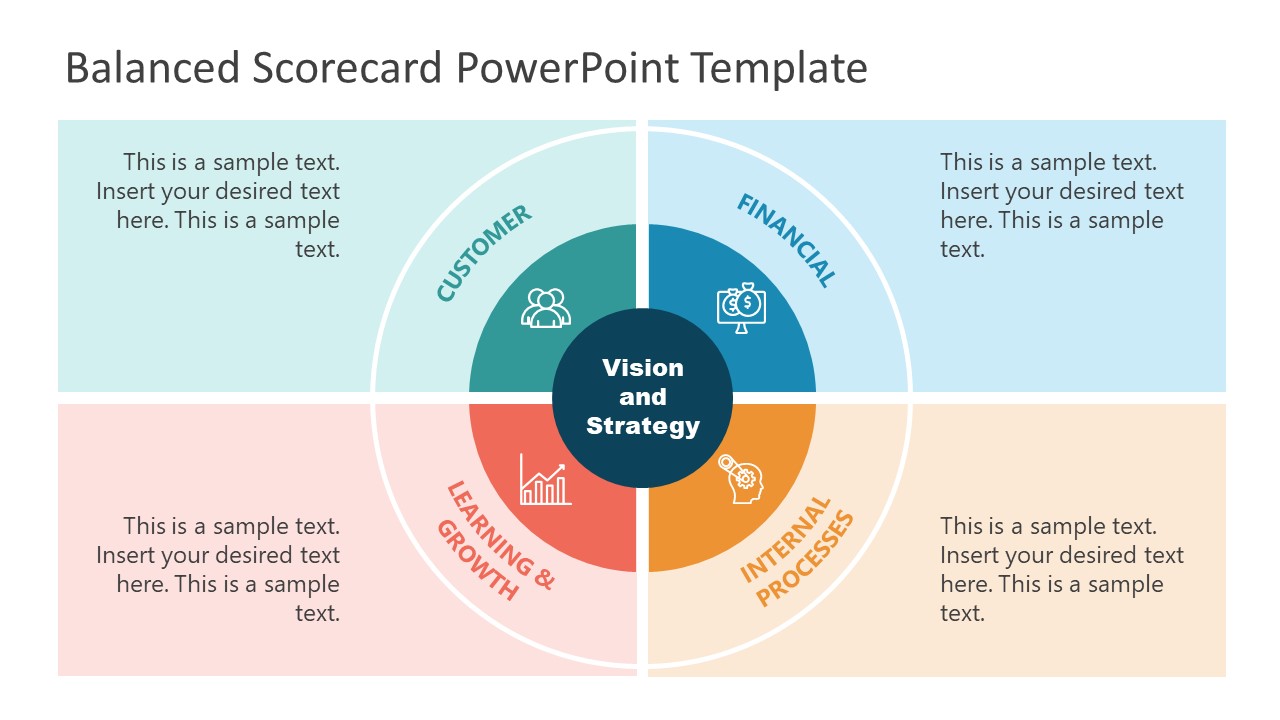
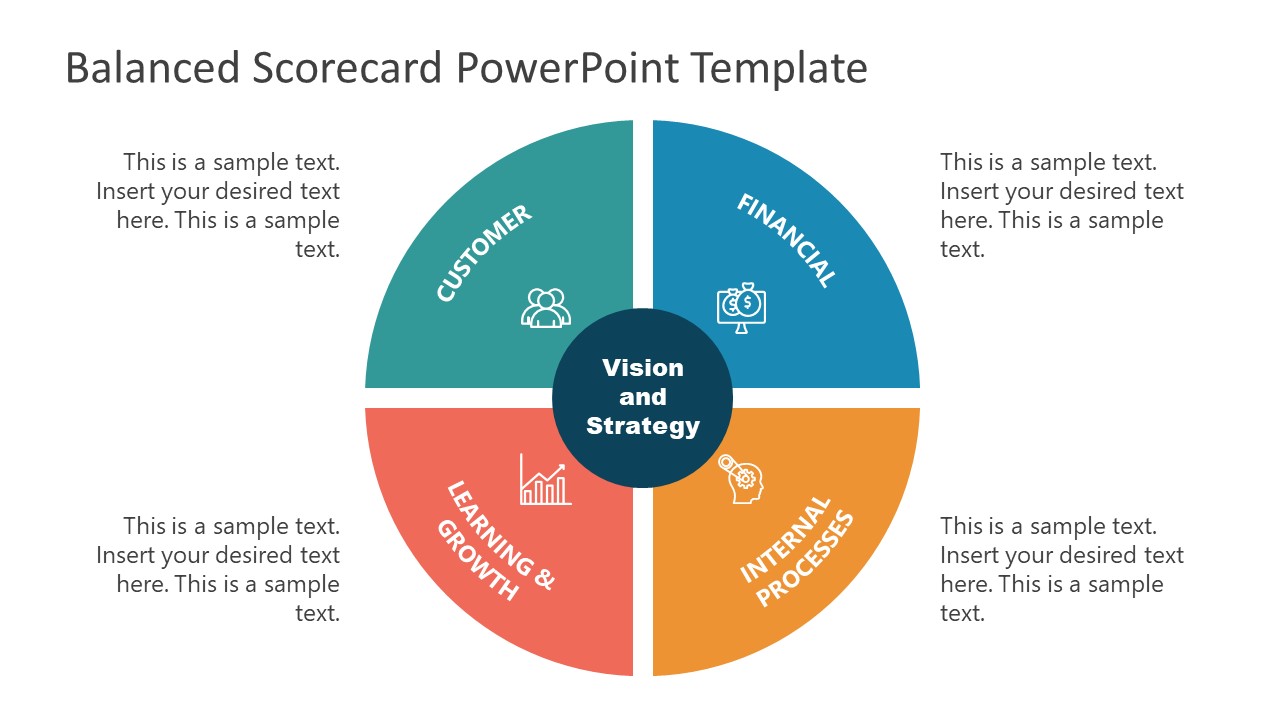
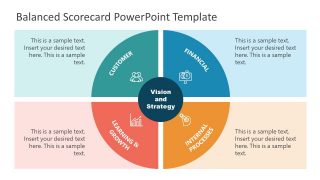
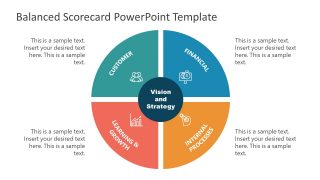
The Balanced Scorecard PowerPoint Template is a 4 steps diagram that outlines four business objectives. There are three layout versions of the balanced scorecard available scorecard in four-quarter format. The four segments in the matrix diagram have an inner circular diagram highlighting four balanced scorecard components. These are Financial, Internal Processes, Learning & Growth, and Customer. You can use these slides in strategy planning and performance management presentations. The balanced scorecard template diagram enables managers and teams to view what business objectives are met. You can describe the implementation and execution of planned activities in four parts of a business.
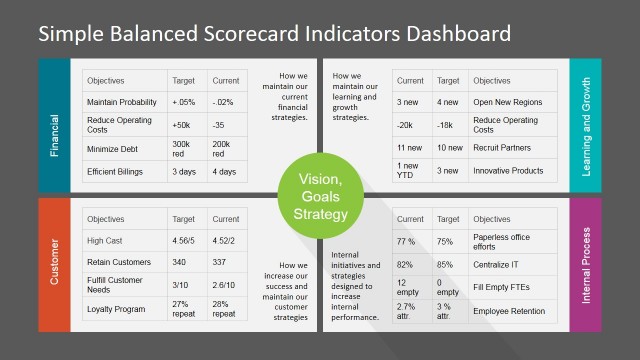
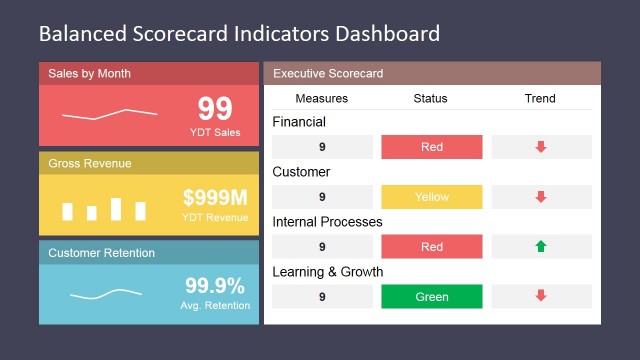
The Balanced Scorecard template PPT is a 4 steps performance management tool that summarizes KPIs. These are the measure of four main business areas: finances, processes, growth, and customers. For a business to succeed, the balanced scorecard suggests more perspectives to measure apart from financial performance. You can use the balanced scorecard to measure four areas of organization and individual objectives. Alternatively, individuals, strategists, and consultants can download other Balanced Scorecard templates for presentations, including BSC slides and layouts for Google Slides and PowerPoint.
The Balanced Scorecard PowerPoint Template contains three editable slides in a multi-color diagram. The color-coded shapes show headings and information placeholders. The clipart icons in the circular part of the balanced scorecard are a visual representation of all four areas. The screen icon with money bags visualizes financial KPIs i.e., revenue and shareholder values. The internal process perspective shows a human head with gears for operations. The learning and growth KPIs section is represented by the trend chart icon. It reflects the measuring of employee retention, employee satisfaction, training, and ad development. Users icons for customers visualize KPIs of customer satisfaction and market share.

You must be logged in to download this file.
DOWNLOAD- Category
- Business PowerPoint Templates
- Rating


 Loading...
- Size
- 16x9
- Item ID
- 21017-01
- Colors
Subscribe today and get immediate
access to download our PowerPoint templates.