PowerPoint Scorecard Templates for Presentations
Check our selection of Scorecard Templates for PowerPoint & Google Slides to represent statistical records applied to achievement or progress towards a goal. Displayed in table or dashboard layouts, these editable scorecard PPT templates offer an easy-to-use method to provide insights into competitive positioning.
Featured Templates
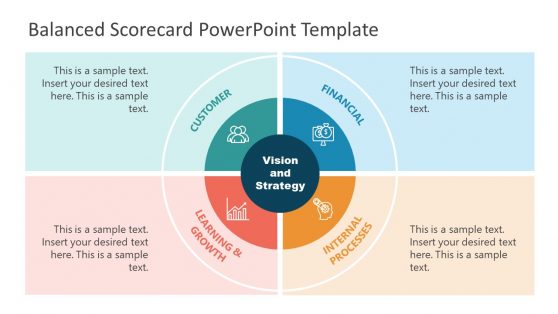
Balanced Scorecard PowerPoint Template

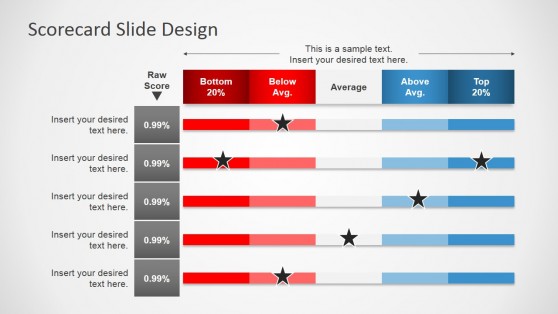
Scorecard Slide Template for PowerPoint
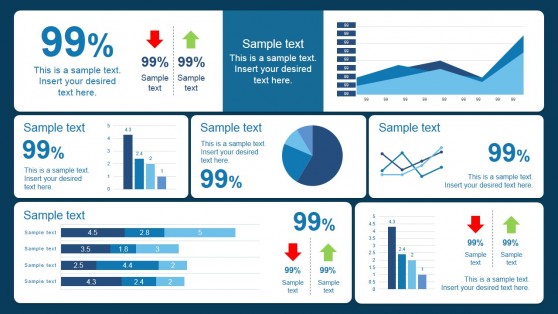
Scorecard Dashboard PowerPoint Template
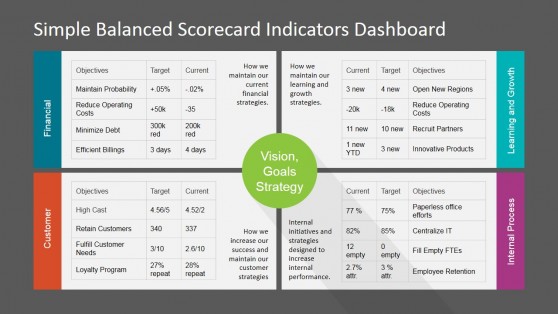
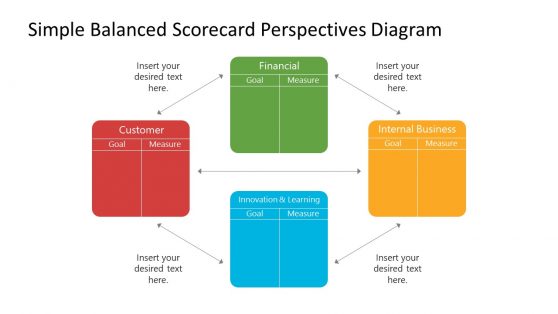
Simple Balanced Scorecard KPI PowerPoint Dashboard
Latest Templates
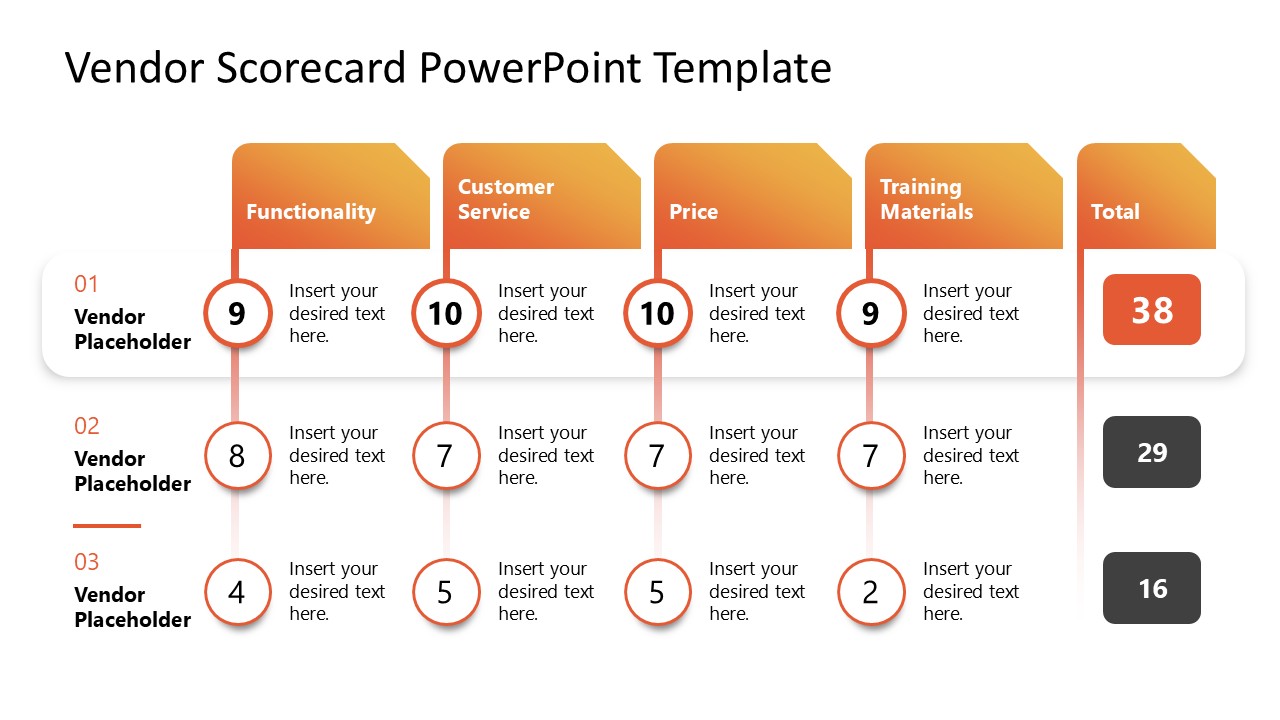
Vendor Scorecard PowerPoint Template
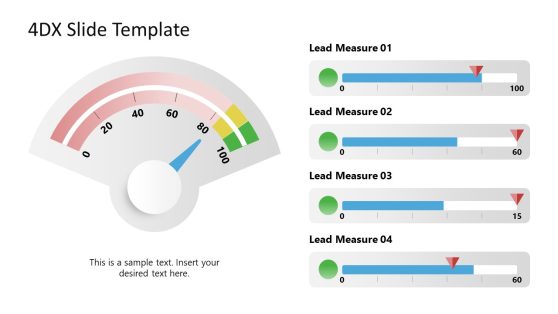
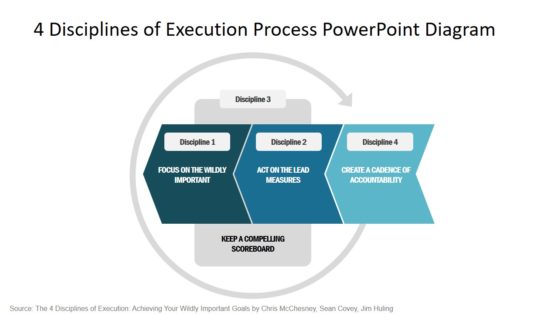
4DX PowerPoint Template

Vendor Management PowerPoint Template

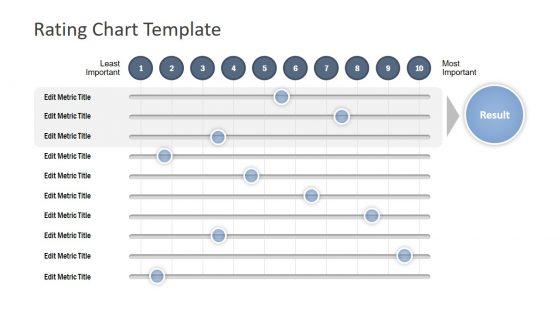
Rating Chart PowerPoint Template
Scorecard Slides for PowerPoint
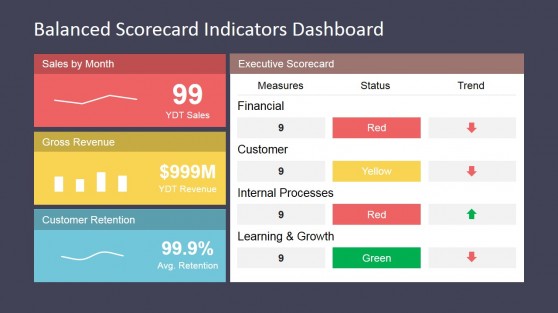
Balanced Scorecard Indicators Dashboard
PowerPoint scoreboard templates are structured to support the visualization of critical data points. They often include customizable charts, graphs, and tables that allow presenters to effectively convey sales figures, customer satisfaction levels, production rates, and other relevant metrics. Visual elements like bar charts, pie charts, line graphs, and heat maps help break intricate data into understandable segments, facilitating more straightforward interpretation and analysis.
These scorecard templates are equipped with editable design elements like color coding, icons, and thematic styling, enhancing the aesthetic appeal and aiding in categorizing and emphasizing crucial information. Presenters can customize the slide designs to ensure each presentation can be tailored to meet the organization’s or project’s specific needs and branding requirements.
What is a PowerPoint scorecard template?
A PowerPoint scorecard template is a pre-made presentation tool used primarily for tracking and displaying performance metrics, objectives, or key performance indicators (KPIs). Its application is culturally linked to sports practices, although businesses and individuals can harness the practicality of these tools to track the evolution of ongoing projects.
What are the four pillars of a scorecard?
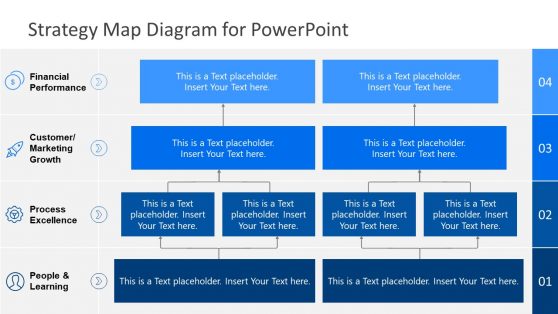
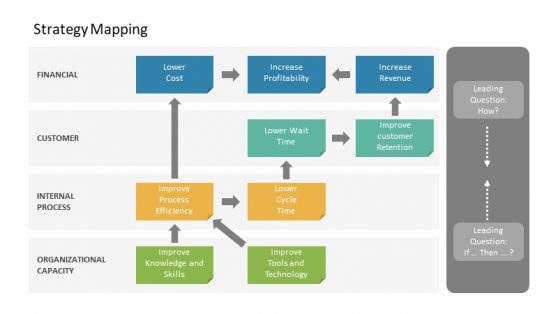
The four pillars in scorecards refer to four key dimensions or perspectives that comprehensively view an organization’s performance. These pillars are derived from the Balanced Scorecard framework developed by Robert S. Kaplan and David P. Norton.
- Financial Perspective: Refers to the financial performance of an organization, and it’s measured through standard metrics like net profit, ROI, revenue growth, and cost management.
- Customer Perspective: Measures how well the organization meets customers’ needs and expectations.
- Internal Business Processes: This evaluative phase optimizes and streamlines internal processes to improve efficiency and quality.
- Learning and Growth Perspective: The innovation rate of the company is measured in terms of employee training and development, organizational culture, knowledge management, and employee satisfaction and retention
How do you create a scorecard?
To create a scorecard, define objectives, identify relevant KPIs, select appropriate metrics, design the layout, and present the data visually. PowerPoint provides a user-friendly platform to build a scorecard using tables, charts, and graphical elements to represent your data effectively. We highly recommend you work with our ready-made scorecard templates for PowerPoint and Google Slides to speed up this process.