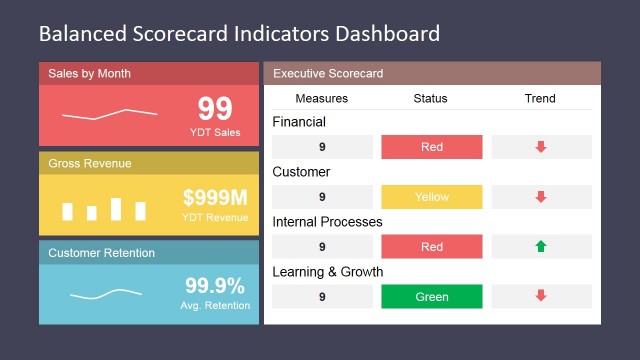
Simple Balanced Scorecard KPI PowerPoint Dashboard
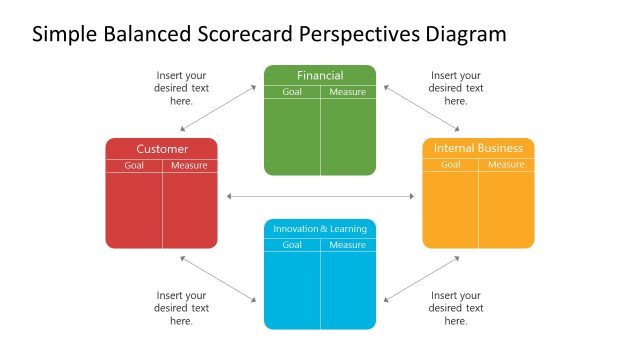
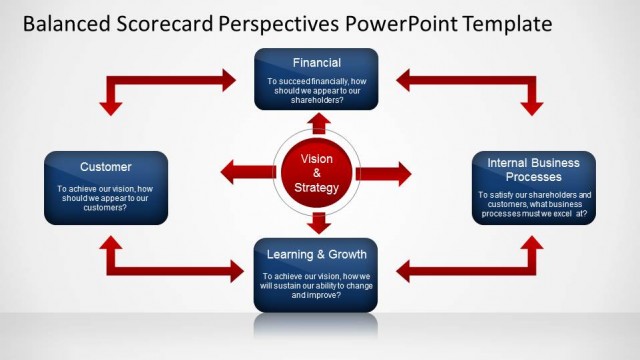
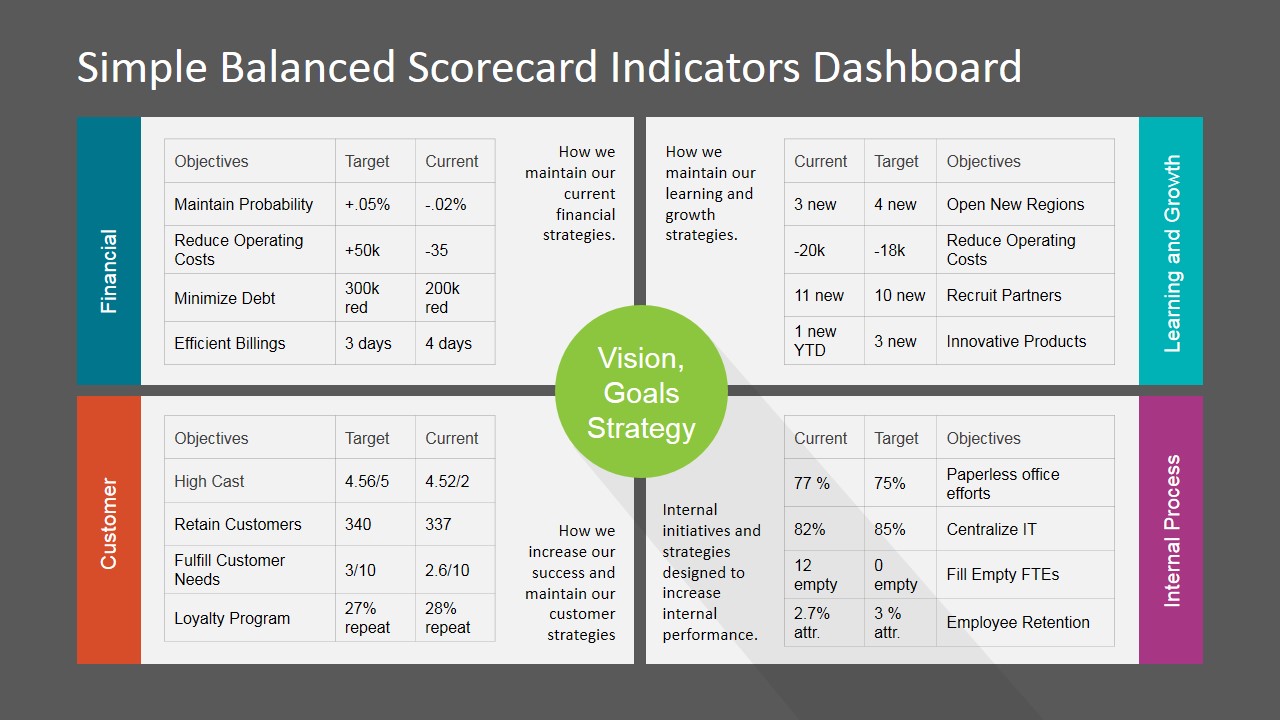
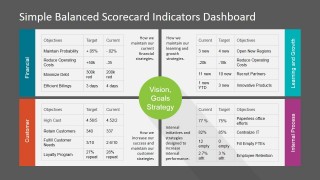
Simple Balanced Scorecard KPI PowerPoint Dashboard – Professional presentation featuring a Balanced Scorecard Dashboard with four Key Performance Indicators in each of the four main perspectives. The PowerPoint Dashboard layout is constructed with a four quadrants matrix. In the center, a PowerPoint Shapes featuring strategy keywords. Each of the quadrants describe with a text placeholder the objective that the area will measure.
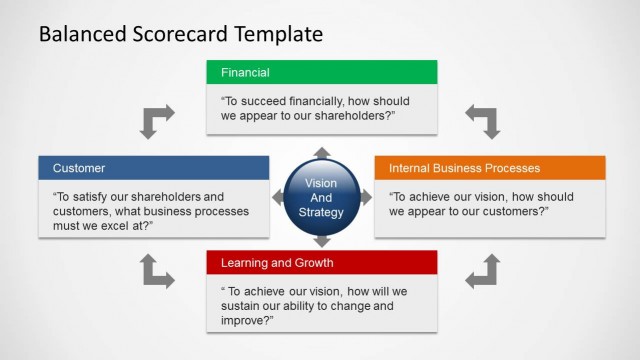
The strategic objectives areas featured are:
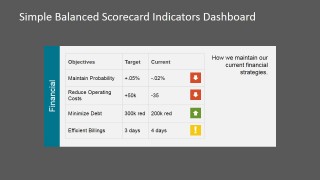
- Financial.
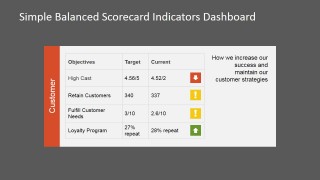
- Customer.
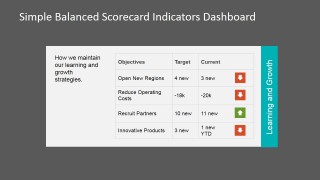
- Learning and Growth.
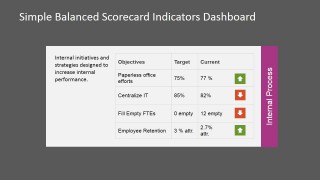
- Internal Process.
Users can apply the Simple Balanced Scorecard KPI PowerPoint Dashboard to monitor progress towards the pre-defined strategic objectives.
Executives and Strategists apply the balanced scorecard template to translate vision, mission , values and competitive strategies into actionable objectives that allow the organization to apply tactics to reach them. Every professional organization with Strategy Management needs to present and describe their current strategy position to the board. Executives and Strategy Professionals take regular snapshots of their KPI and presents the results to the board and interested stakeholders. When building a clear visual representations of the balanced scorecard it is important to show what really is important and highlight the indicators trend in order to re define the tactics to be applied for reaching strategic objectives.
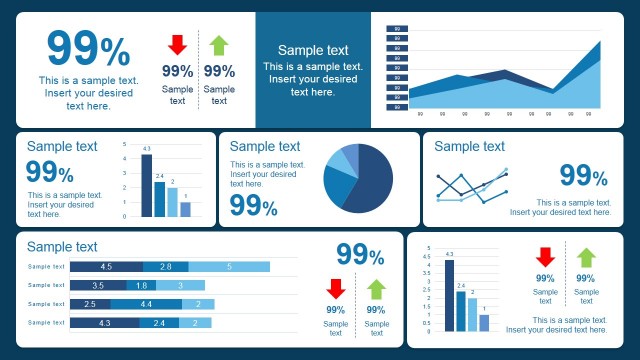
Balanced Scorecard KPI’s require predefined objective values, represented as the Target values in the template tables, the snapshot is labeled as the Current value. In order to show the trend, arrows PowerPoint Icons are used to quickly allow the interpretation of the information for rapid decision making.
All the elements of the Simple Balanced Scorecard KPI PowerPoint Dashboard are created as PowerPoint objects, using Tables, clipart and Icons that are 100% editable. The PowerPoint Objects can be customized through PowerPoint theming,allowing the user to apply the dashboard in existing presentations preserving the branding original theme.
Create your Balanced Scorecard Results presentation with the Simple Balanced Scorecard KPI PowerPoint Dashboard that appeals to executive audiences.


You must be logged in to download this file.
DOWNLOAD- Category
- Strategy
- Rating


 Loading...
- Size
- 16x94x3
- Item ID
- 6760-02
- Colors
Subscribe today and get immediate
access to download our PowerPoint templates.