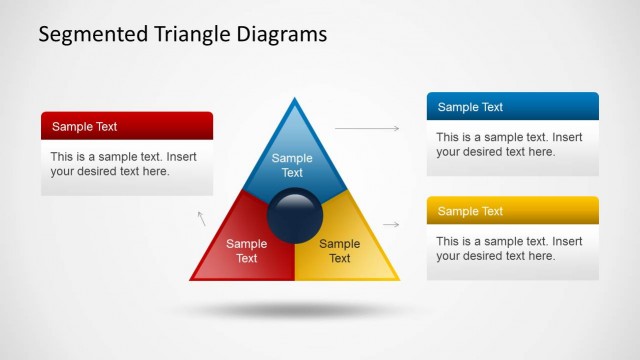
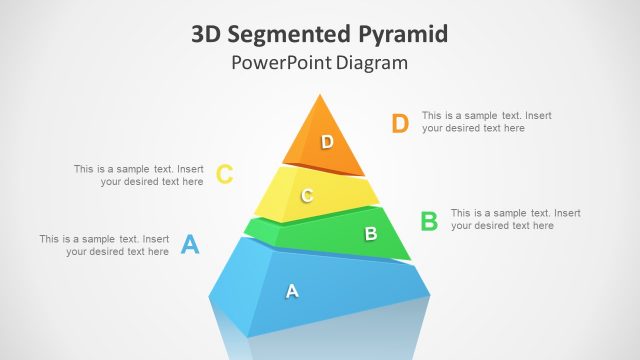
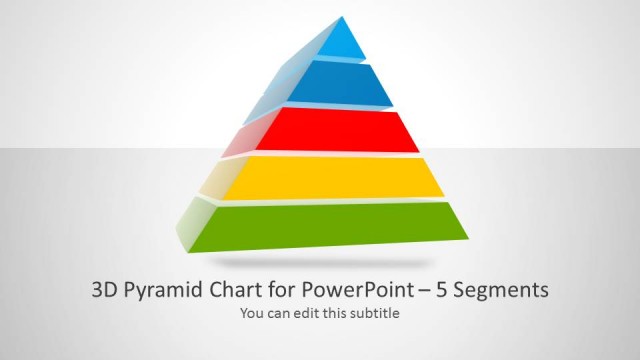
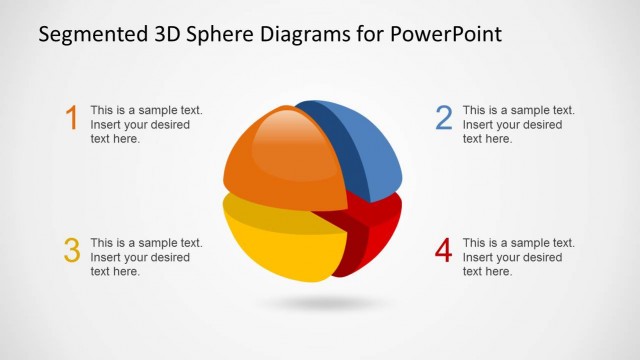
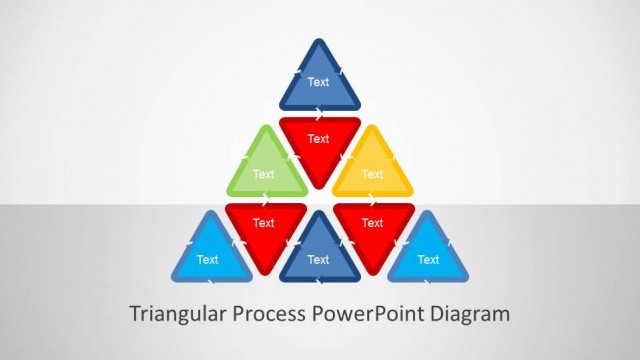
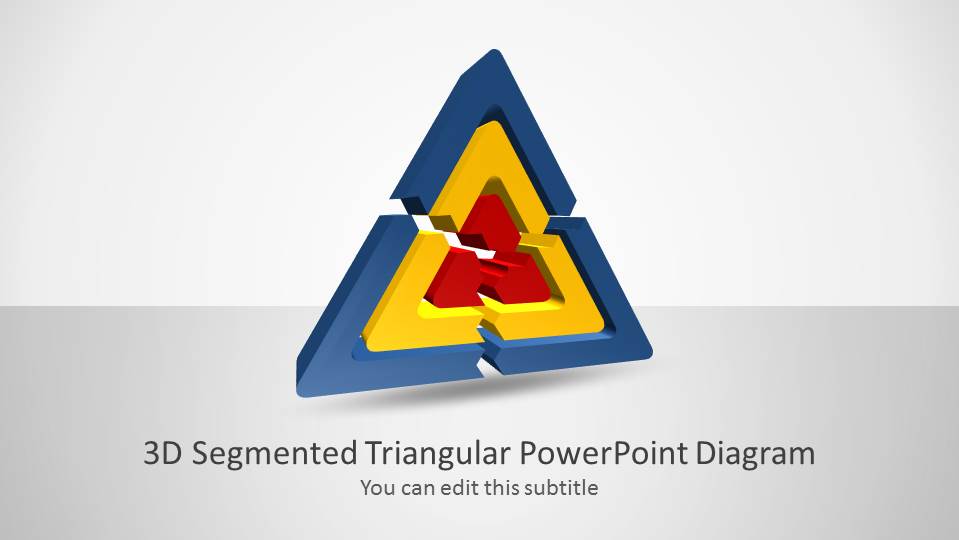
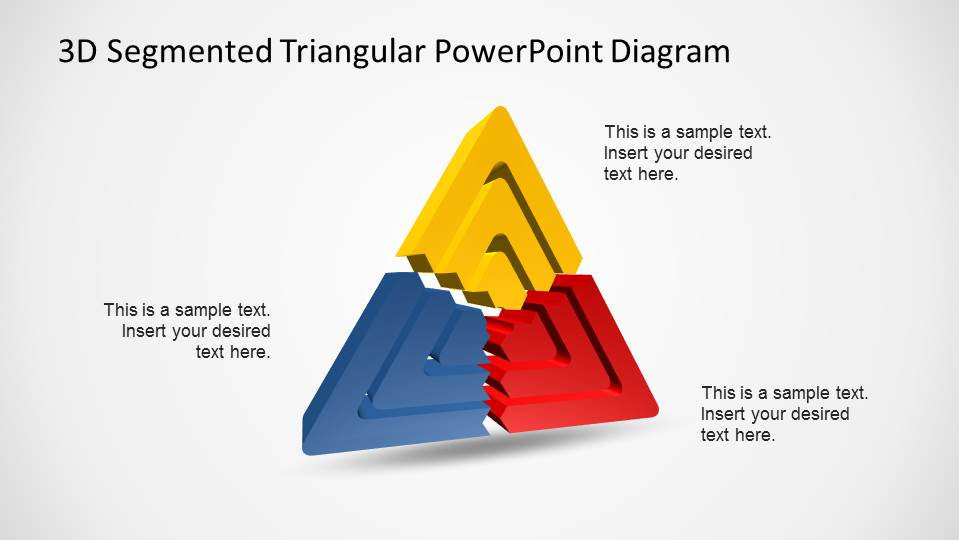
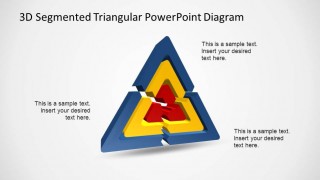
3D Segmented Triangular PowerPoint Diagram is a professional presentation created with PowerPoint triangular shapes and 3D effects. The Segmented Diagram has three layers, which are broken down into three steps, giving a total of nine combination steps.
This diagram allows the creation of several models as Marketing Segmentation Strategies, Layered models like Software Architecture Models or Network Models (ie: OSI). Also simple models can be created with this shapes as they are a 100% editable.
Complement your presentation with this professional PowerPoint Segmented Diagram and save countless hours of manual work creating high quality PowerPoint visuals.
What’s inside this template
Example presentation scenarios
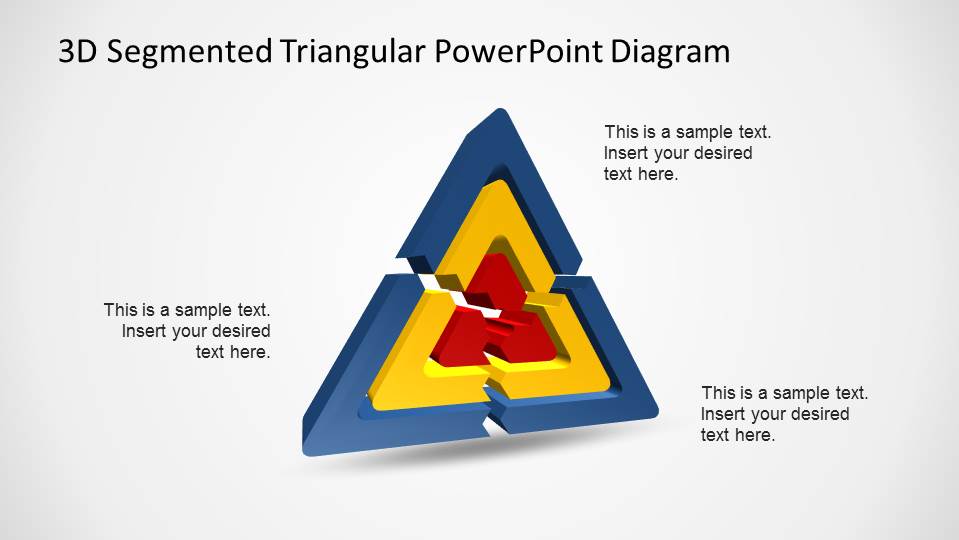
- A marketing strategist can use the nested 3D triangle to explain three segmentation layers and place concise definitions in the surrounding callouts.
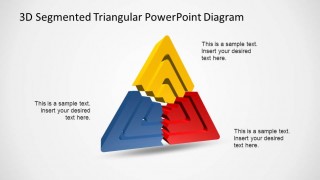
- An IT architect can use the exploded layered model to show how system layers separate while still forming one connected triangular structure.
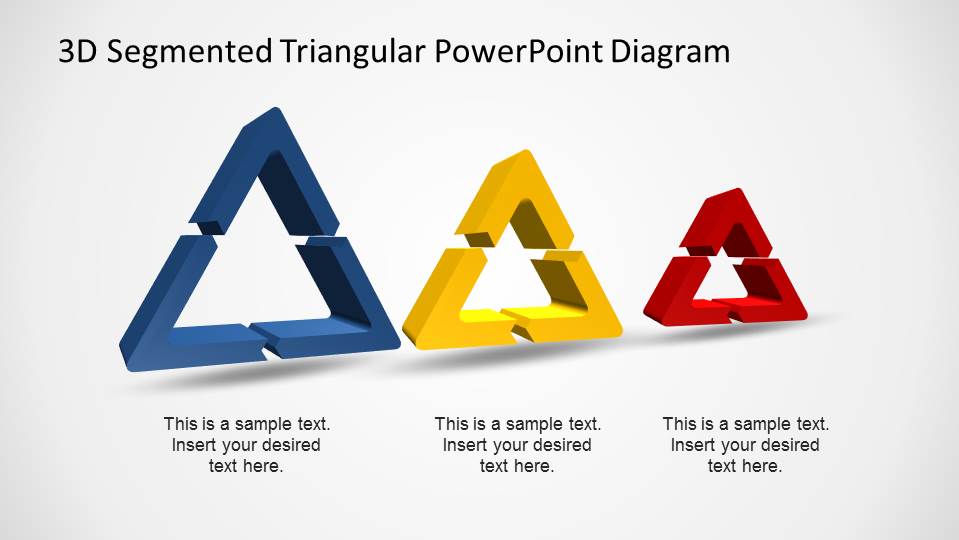
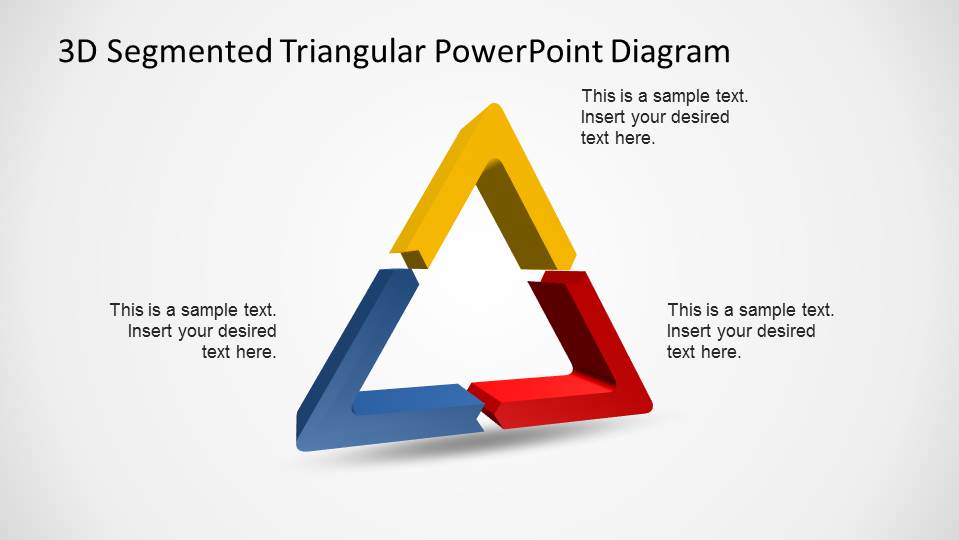
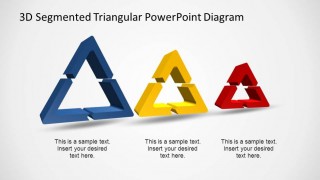
- A consultant can use the three separate triangle diagrams to compare three service tiers, market groups, or implementation options side by side.
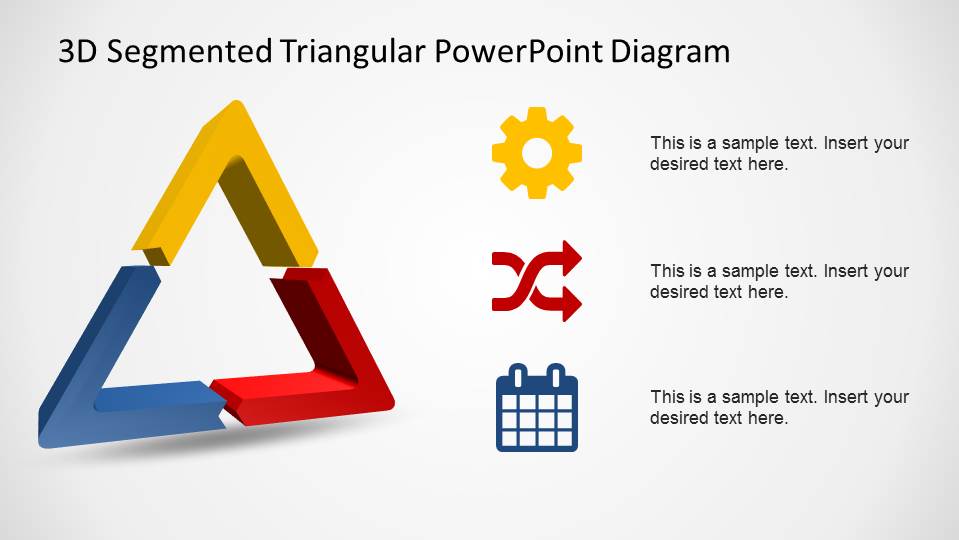
- A project manager can use the icon callout slide to connect the triangle model with operations topics such as configuration, process changes, and schedule planning.
Features
- 100% editable presentation template
- Compatible with Microsoft PowerPoint and Google Slides
- 16:9 aspect ratio slides
- Scalable vector shapes, icons and illustrations
- AI-Ready for Microsoft Copilot and Claude
- Instant access and download
Frequently asked questions
Q: How should a presenter explain the triangular model without overloading the slide?
A: Start with Slide 2 or Slide 5 and assign one clear meaning to each colored segment before adding detail. Keep each callout to a short label and one supporting phrase. The 3D shape already carries visual weight, so the presenter should use spoken explanation for nuance instead of filling every text box.
Q: Who is this diagram best suited for in a business presentation?
A: This diagram works best for consultants, strategists, analysts, and technical presenters who need to explain how three related parts form one model. It fits marketing segmentation, layered software architecture, service tiers, or operating models where the audience must see both separation and connection in a single visual.
Q: Why use a segmented triangle instead of a standard list or table?
A: The triangular metaphor shows balance, dependency, and structure more quickly than a list. The nested and exploded versions let the presenter move from the complete system to its parts. Because each colored side is visually distinct, the audience can track categories across comparison, layer, and icon callout slides.
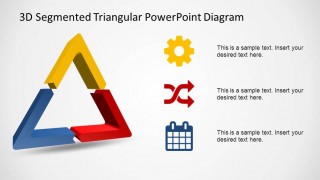
3D Segmented Triangular PowerPoint Diagram
6-slide presentation template with 3D triangle segments and layered diagram layouts
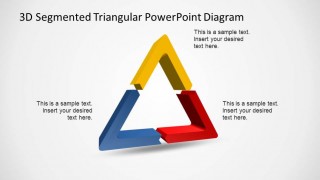
3D Segmented Triangular PowerPoint Diagram is a 6-slide diagram template for Microsoft PowerPoint and Google Slides. It includes a 3D triangular cover, nested layered triangle, three-segment comparison, exploded layered model, single ring diagram, and icon callout slide for explaining segments, layers, or step groups.
- Category
- Diagrams
- Rating


 Loading...
- Aspect ratio
- 16:9, 4:3
- Item ID
- 6414-02
- Colors
 Microsoft PowerPoint
  Microsoft Copilot
  Claude for PowerPoint
 Other formats supported
Subscribe today and get immediate
access to download our PowerPoint templates.