Corporate, academic, and business meetings share one common factor: successfully delivering project presentations. This is one skill professionals should harness in terms of articulating ideas, presenting plans, and sharing outcomes through an effective project presentation.
In this fast-paced reality where new tools and frameworks make us question the human factor value, we believe there’s much to be said about how working towards building presentation skills can make a difference, especially for making a project stand out from the crowd and have a lasting impact on stakeholders. We can no longer talk about simply disclosing information, the manner in which the narrative is built, how data is introduced, and several other factors that speak of your expertise in the subject.
This article will explore the art of project presentation, giving insights to presenters to deliver a memorable project plan presentation. Whether you are new to this experience or a seasoned presenter, this article promises to give you valuable information on how to build and present a project presentation that resonates with your target audience and will convert into your expected results for the project. Let’s get started.
Table of Contents
What Is a Project Presentation?
A project presentation is a business activity that brings together stakeholders and team members to oversee a project from execution to completion. During a project presentation, one or two people present a document or slide deck with an overview of all the project’s details.
During a project presentation, the project manager highlights key data about the project initiation and planning activities, like the project scope, requirements gathering, a deliverable list, timelines, and milestones.
The first instance of a project presentation is right before the execution of the project itself. Then, during the project process life cycle, you present it again with timely updates and news about the progress.
Who is the audience of a project presentation?
A project-related audience is made up of stakeholders – all individuals and entities that affect or are affected by the project’s existence.
The Team
Discuss the project presentation with team members that’ll work on the project so they know what’s at stake and what’s expected of them. They’ll need information like requirements, the roadmap, the work breakdown structure, and deliverables.
Stakeholders
Present your project to the stakeholders that can authorize resources and expenditures. Show them how the project will offer the solutions they want under the conditions they impose in a set amount of time.
Stakeholders want to know details like project scope, budget breakdowns, timing calculations, risk assessments, and how you plan to confront these risks and be ready for changes.
The Structure of a Project Presentation
Project presentations follow a standard structure covering all critical elements. Follow this guideline to ensure that you cover everything with the slides, the speech, and the discussion.
In the next section, we describe a project presentation structure you can build with SlideModel templates or working with our AI PowerPoint generator. As you will see, most sections in the structure are summaries or overviews of project management practices completed during initiation and planning.
Executive Summary
At the start of your presentation, add an executive summary slide. This section is meant to welcome the viewer to the presentation and give an idea of what’s to come. To differentiate your executive summary from the project overview that comes right after it, use the opportunity to place the project into context.
In an executive summary, show how this particular project fits into the overall strategy for the company or the section it belongs to. If, for example, your project is about TikTok Marketing, offer information as to how it fits in the overall marketing strategy.
Project Overview
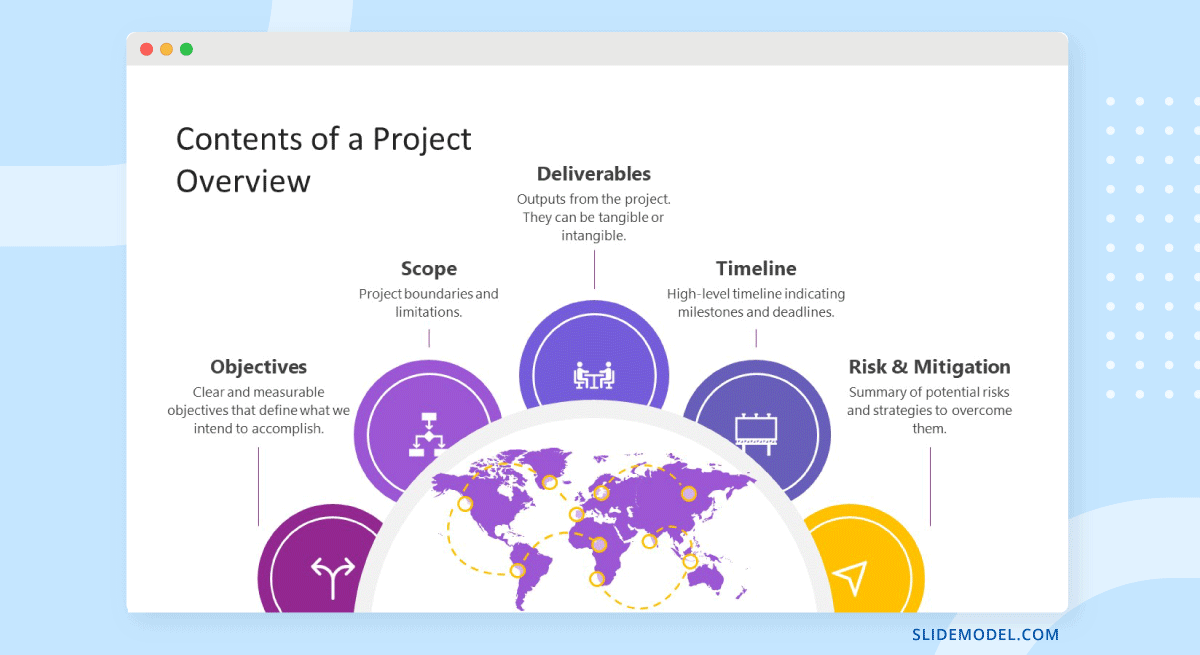
Continue the presentation with a project overview to show the audience what to expect. This section covers one slide or a combination of slides depending on the layout. The project overview slide serves as the introduction to a project presentation and what’s inside.
Include these items:
- An Introduction with a brief background about the project.
- A short explanation of the project’s objectives and completion goals.
- A quick overview of the timeline with start and end dates.
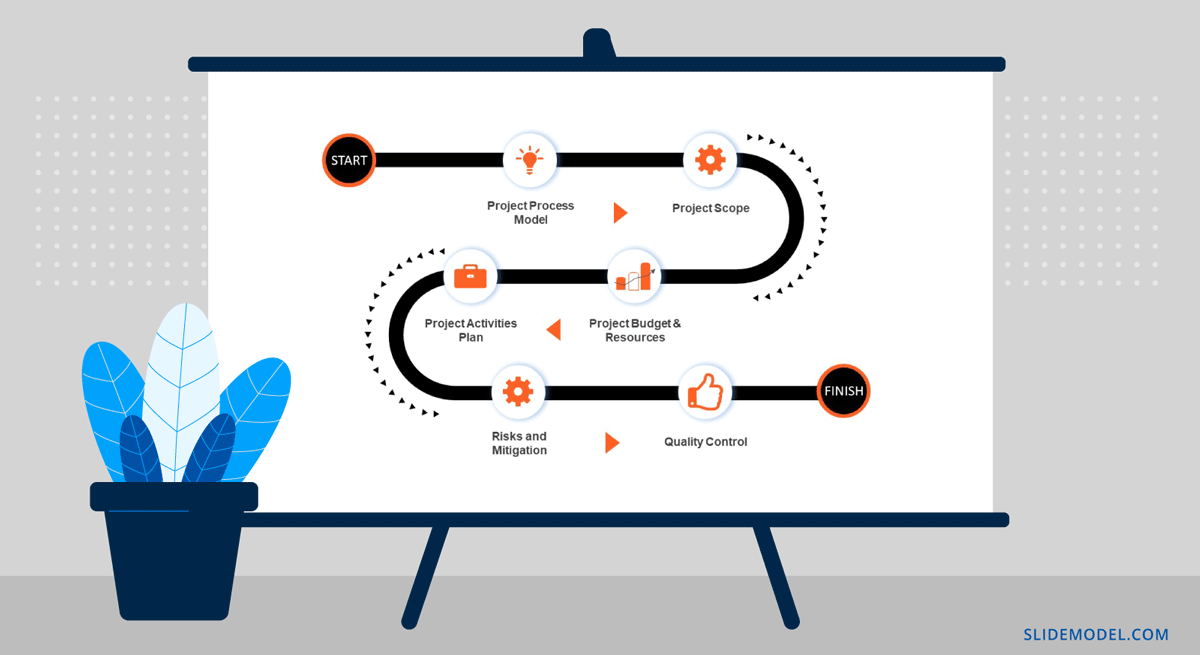
The Project Process Model
The project life cycle is the series of phases that a project goes through from its inception to its completion. The project process model is the group of knowledge areas, processes, and their relationships that will guide the activities along the project lifecycle. The next slide should display the chosen project process model and explain how it’ll be carried out along the different lifecycle phases. Project process models examples include Waterfall, Scrum, and V Model for software development, and Business Process Modeling Notation (BPMN) and Swimlane for general business-related projects.
Process models are important for the team to understand execution processes. Stakeholders need to see the process model to understand the systematic process of activities and how long they will take.
Use one slide for the model, show only high-level components, and offer details during the presentation if the audience asks for them.
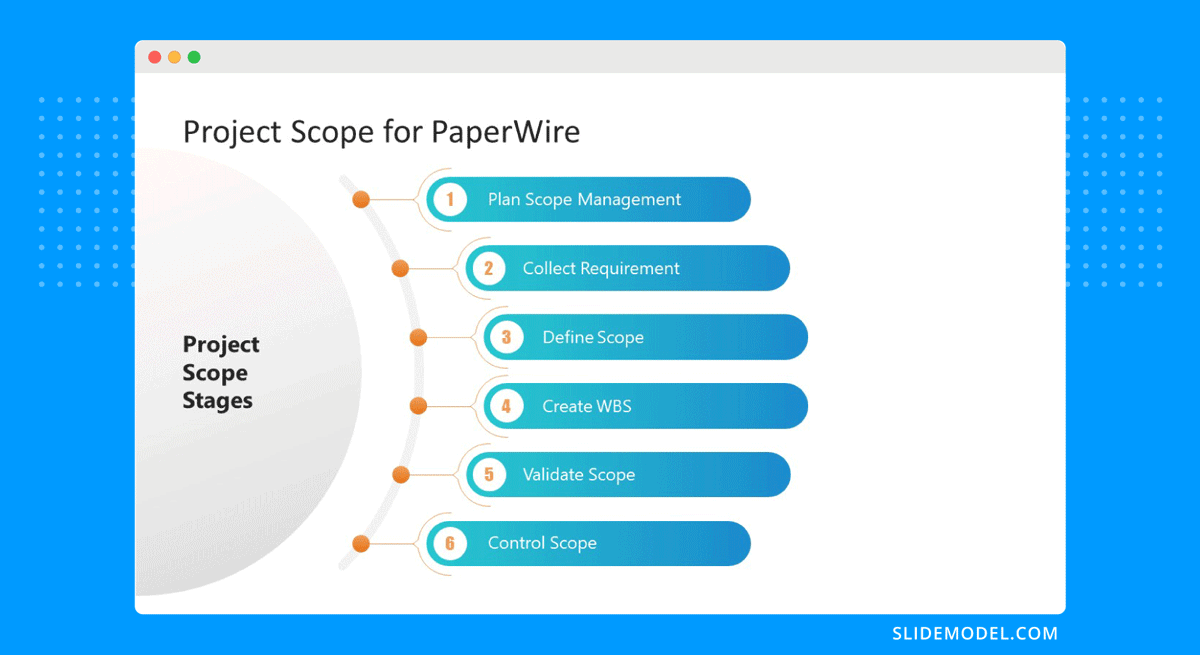
The Project Scope
The scope is a crucial element of any project and needs its own section in the presentation. The scoping process begins with requirements gathering and includes the creation of a work breakdown structure, an analysis of what’s in and out of scope, plus validation and scope management plans.
One or two slides are enough to highlight key scope details in a dashboard-style layout mirroring the information on your project scope statement. Preferably, place the scope slides towards the start of the project presentation close to the process model and project resources.
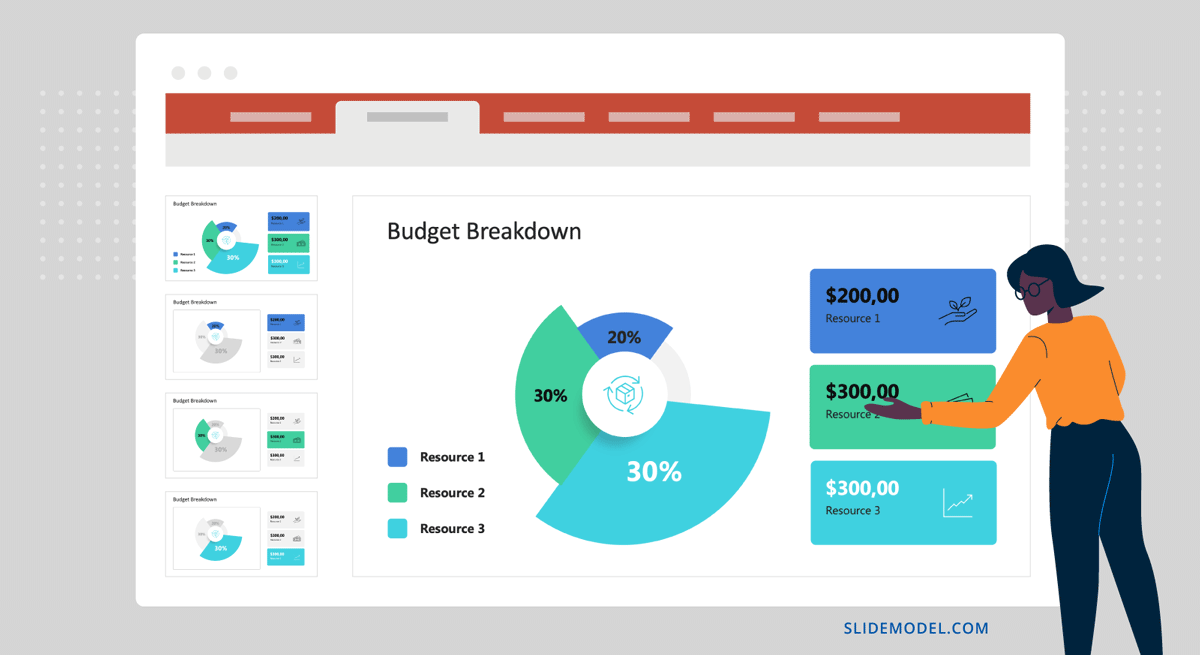
The Project Resources
Every project needs resources, and that assessment must be included in the project presentation as well. In a general sense, all resources are what make up the overall budget for the project. In turn, you’ll need to show a budget breakdown that shows high-level resources.
Like many aspects of a project presentation, what you include depends on the industry you’re working for. Construction projects use constructors, materials, machinery, etc. Software projects use programmers, designers, software licenses, computers, etc.
The Project Roadmap
Time is the main resource of any project. During project planning, the project management team estimates the required effort needed to complete the defined scope. Using the Project Process Model, Scope, and Resources, a plan is built. Present a roadmap to highlight the expected time for project completion and where each milestone falls along that line.
Roadmaps can be constructed with an infinite variety of visual layouts, from highly creative and illustrative to structured formats resembling spreadsheets and tables with color-coded roadmaps across the cells. Use one slide to show the roadmap highlighting time estimates, constraints, and projections. For updated project presentations, mark where the project is on the roadmap at that particular moment in time.
The Project Activities Plan
Every phase of the roadmap is broken down into action plans. Action plans list activities, their duration, allocated resources (human, material, and financial), and the relationship between activities.
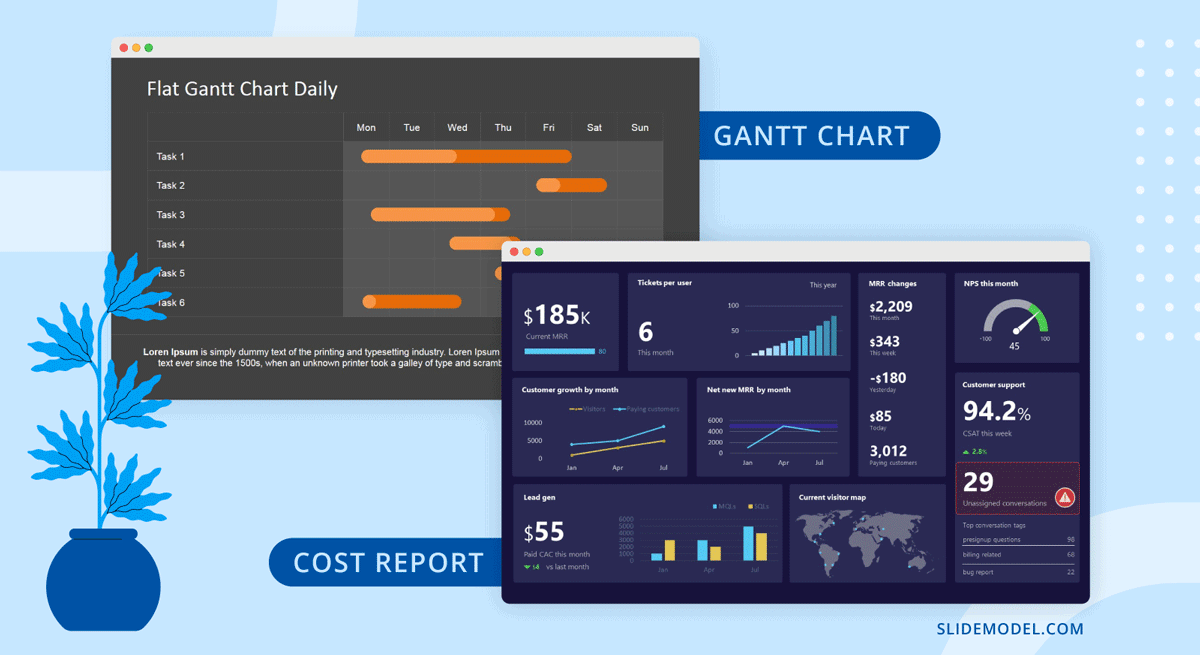
Present your project activities plan with a Gantt Chart and a Costs Report. The Gantt Chart will show the activities to execute, how long they will take, and who (person or team) will be responsible for them. The costs reports will show how much the execution of activities will cost.
During the presentation, you’ll spend the most time on this section, as this is when and where your entire plan is outlined. To show more detail than the roadmap overview, use a few slides to show specific sections of the main Gantt chart and show key activities per phase or milestone.
The Project Risks
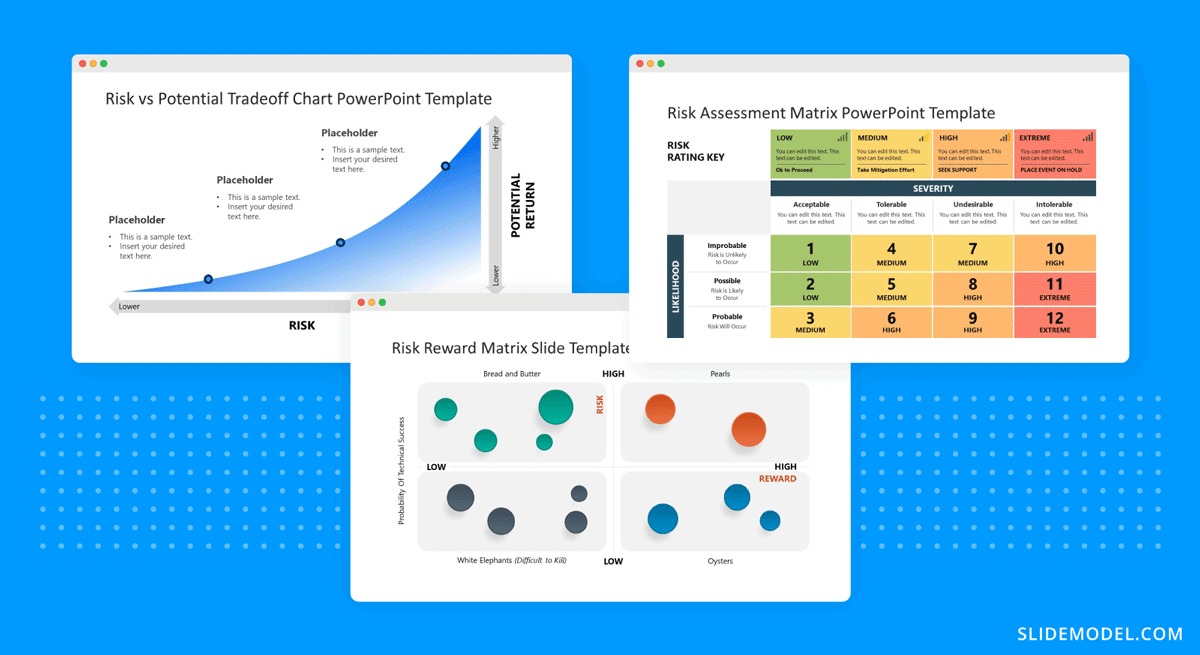
All projects present risks, and to control them, they must be identified, assessed, evaluated, and mitigated. Visualize your risk assessment with a risk matrix and include it in the project presentation.
Use this slide to explain to stakeholders how you plan to mitigate the identified risks. Share with team members what’s expected of them in order to keep the risks under control. Risk management is a critical component of project management and something stakeholders will always be looking at.
Quality Control
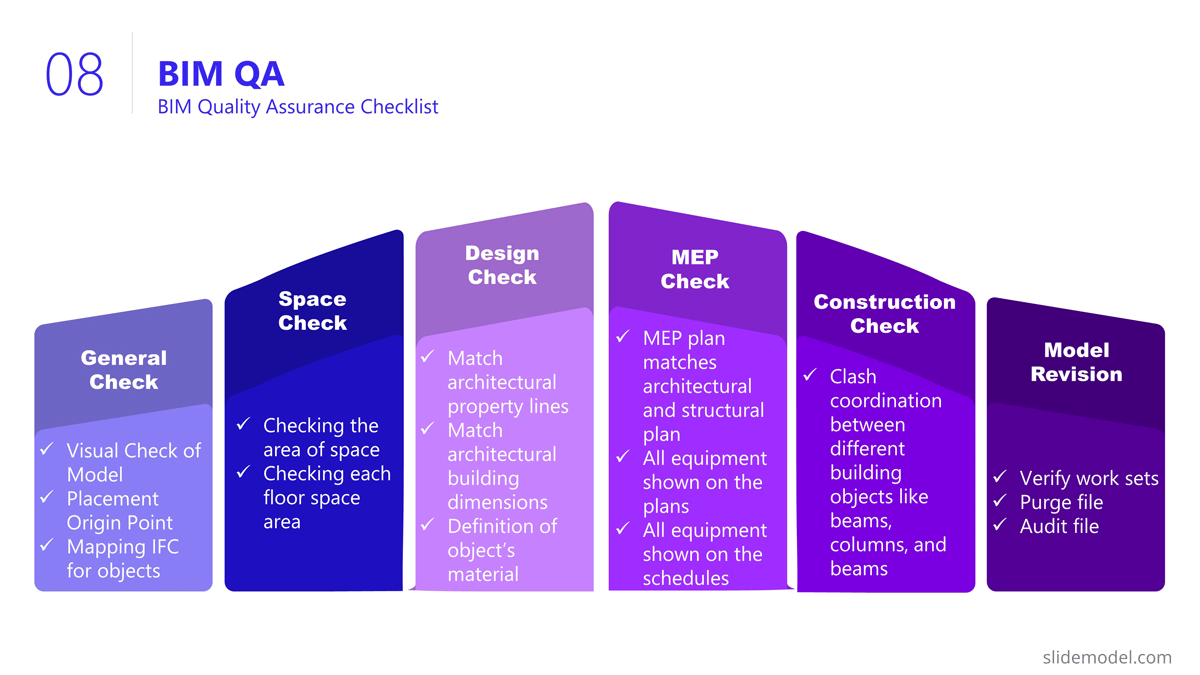
Controlling the quality of project deliverables is critical for positive project outcomes and continued success with the deliverable. This process is called quality control or quality assurance.
The project process model includes which quality control techniques the team will use and when. Some quality assurance (QA) techniques include statistical process control (SPC), Six Sigma, ISO 9000, and Total Quality Management (TQM). Use one slide to visualize the process and your plan to execute it.
Project Execution and Monitoring
Once the project starts, the project plan is a living entity and evolves over time. This section will need to be regularly updated with progress reports, performance KPIs, and status updates.
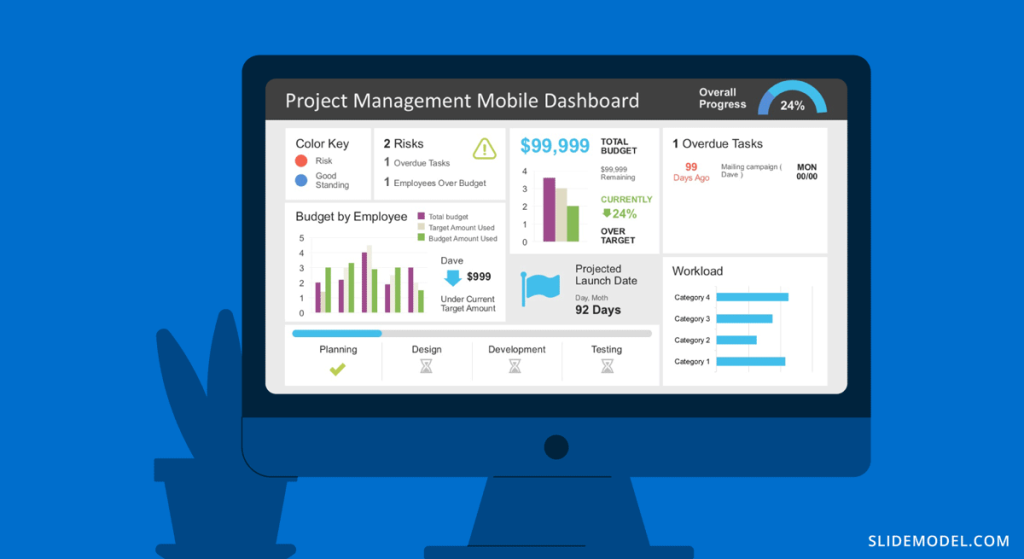
Across these slides, explain how activities will be monitored and deliverable outcomes measured. Show exactly how you will determine if the project is on course or has deviations. Visualize all execution activities with a Gantt chart to show the current progress. Use big numbers and data points to highlight performance metrics. Use a comparison slide to visualize the completeness percentage vs. planned progress and budget consumption vs. planned budget.
Explain all monitoring activities for the execution phase using a calendar or schedule that shows on what days activities will take place and who is involved.
The Project Team
When presenting a project, include a stakeholder map to describe the management team, the sponsors, the main stakeholders, and the implementation team or teams. Depending on the size of the project, this will be an org chart or multiple org charts across a few slides.
Why is it important to present the project team to the stakeholders and vice versa? So that everyone involved knows the other parties and their responsibilities.
Another use for the team slide or slides is to present the next person who will speak during the project presentation. This gives the audience some background on that person’s role in the project.

Case Study – Project Presentation Example
Using the structure we present above, we outlined a case study of a realistic project and how the project manager puts together the project presentation using SlideModel templates. The project presentation example is based on a complex project of building a bridge (Cline Avenue Bridge). For the educational purpose of this article, we are not delivering all the elements of the project presentation, as it is out of scope. Still, we illustrate the more representative slides of each section, show how to prepare a PowerPoint Presentation for a project and how simple it is to adapt the templates to the content that needs to be presented. As a disclaimer, all information we present is an adaptation and reinterpretation of the real project, modified by SlideModel to fit the use case learning goals. This information and presentation should not be considered a source of information related to the Cline Avenue Bridge Project.
Project Overview
In this slide, the presenter summarises the project highlights in a project charter style. The Project Manager can extend this introduction all over the project lifecycle, and the speech can jump from different knowledge areas without the need to change slides or get deeper into details. Specifically, in the Cline Bridge Project, the objective is narrated, the location is just mentioned and linked to a map for further details, and a set of important facts are presented (Building Information Modelling Process, Budget, Duration, Sponsor, and Constructor). Key Highlights of the final deliverable are listed (Segmental Bridge, Material Concrete, 1.7 miles of length and 46 feet of width)

Process Model
The Process Model slide illustrates the framework for the project lifecycle, processes, planning, and execution. In this slide, the Project Manager will describe the model and how it is tailored to the specifics of the project. In this case, for the development and construction of the Cline Bridge, the builder has defined the use of BIM (Building Information Modelling) as the process model. During this slide, the presenter can describe the lifecycle phases (Design, Production, Construction, Operation, and Planning) and drill down one level over the knowledge practices involved. For example, the initial stage consists of “Design”, which has two main knowledge areas, Conceptual Design, and Detailed Design. The project manager is able to explain this definition without the need to outline detailed processes and activities within them.

Scope
The Scope section of the presentation generally involves several slides, as the content layout is a list of “requirements.” Based on this fact, a table layout is suggested to make good use of space. It is important to avoid abusing the “list” and present the group of requirements rather than specific requirements. Otherwise, the project manager ends up transcribing the requirements document.
In this project presentation example, we present 10 groups of requirements traversing different stages of the project lifecycle.
- Conceptual Design
- Design Standards: Bridge design must comply with local, national, and international design standards, including relevant engineering and safety codes
- Load Capacity: The bridge must be designed to safely carry a specific maximum load, which would include the weight of the bridge itself, traffic, pedestrians, wind, and other factors.
- Seismic Design: The design must account for seismic loads.
- Aesthetic Design: The bridge must be designed to meet certain aesthetic criteria aligned with the artists and architects.
- Accessibility and Use Requirements: Requirements for pedestrian walkways, bike lanes, vehicle lanes, load restrictions for vehicles, clearance heights for boats if over a waterway, etc.
- Analysis
- Regulatory Approvals: The project must secure all necessary permits and approvals from relevant local and national regulatory bodies.
- Environmental Impact: The project must take steps to minimize its environmental impact during construction and the operation of the bridge, including implementing erosion and sediment controls.
- Materials Simulation: Materials should comply with regulations and usage expectations for current and future expected requirements.
- Construction
- Site Preparation: The project must include preparation of the construction site, including any necessary land clearing or grading.
- Foundations Construction: Foundations will need to support materials weight and traffic expected for the next 30 years.
- Construction Logistics
- Site Acquisition: Acquire site and terrain for building and logistics.

Resources
Building a bridge involves a high level of resource usage. In an executive meeting of a project presentation, the recommendation is to structure this section as a Financial table with only one level of detail. Further details are delegated to specific resources and cost analysis presentations.
The resources list presented is:
- Professional Services
- Land
- Machinery
- Materials
- Construction Labour
- Quality Assurance
- Contingency
- Waste Disposal and Cleanup
- Subcontractors
In order to break the style of table after table during the project presentation, we suggest using visual elements as icons and colors metaphorically related to each of the elements listed.

Project Roadmap
As explained earlier in the article, the project roadmap serves to offer a comprehensive overview of the significant milestones that will happen over the course of time. Given the magnitude of a bridge construction project and its prolonged duration, it is advisable, particularly for such extensive endeavours, to present a roadmap that aligns milestones with corresponding lifecycle phases in a discernible manner. This approach enables the audience to mentally envision the sequential progression of the construction process.
Aligned with previous slides, in the example we created a roadmap in PowerPoint with the following high level milestones, and sub componentes:
- Project Initiation
- Project Budgeting and Financing
- Contracts
- Permits
- Clearances
- Land Purchase & Renting
- Kick-off
- Design
- Conceptual Design
- Detailed Design
- Site Preparation
- Clearing
- Grading
- Access Routes
- Waste Disposal
- Analysis
- Simulations
- Materials Tests
- Site Tests
- Seismic Tests
- Production
- Fabrication
- Preparation of Modular Pieces
- Construction
- Build and Assembly
- Quality
- Test under Acceptance Criteria
- Stress Test
- Bridge Opening
- Operation and Maintenance
As you can see, the Project Manager decided over a sequential roadmap, presented with little detail in timings, with start and end dates to picture dimension over the diagram.

Action Plan
In the bridge construction project of the example, there will be plenty of activity plans. All along the project several of these slides will be created and updated. The most suitable option for presentation tasks, durations, precedence relationship and resource allocation is the Gantt Chart Template. We present the action plan with the first Quarter of the project, over the Conceptual Design Activities.
As displayed in the PowerPoint Slide, the subtitle clarifies the number of slides that will be used for this purpose.
The activities presented are:
- Conceptual Design
- Site Analysis
- Feasibility Analysis
- Design Concepts
- BIM Model Creation
- Model Revision
- Environmental Impact
- Present Design

Project Risks
Risk management is an iterative process all over the project life cycle. When presenting your projects, the risks will vary depending on the progress over the roadmap. For this specific example we decided to present the risks being discussed during the Ideation stage, where the developer is exchanging risks with contractors and the company that will build the bridge.
Our suggested layout for this kind of information is a simple table, where the risks are clearly readable and visible, while the description is a hint for discussion rather than an in depth explanation.
It is very important to classify the presented risks, at least with two dimensions; “Impact” and “Probability”. This will generate quality conversations around them.
Outlined Risks during the Initiation Phase:
- Design Errors
- Construction Delays
- Budget Overruns
- Regulatory Changes
- Site Conditions
- Equipment Failures
- Health and Safety Incidents
As the reader can spot, the risks outlined, are very high level, and each of them will trigger specific Risk Analysis Reports.

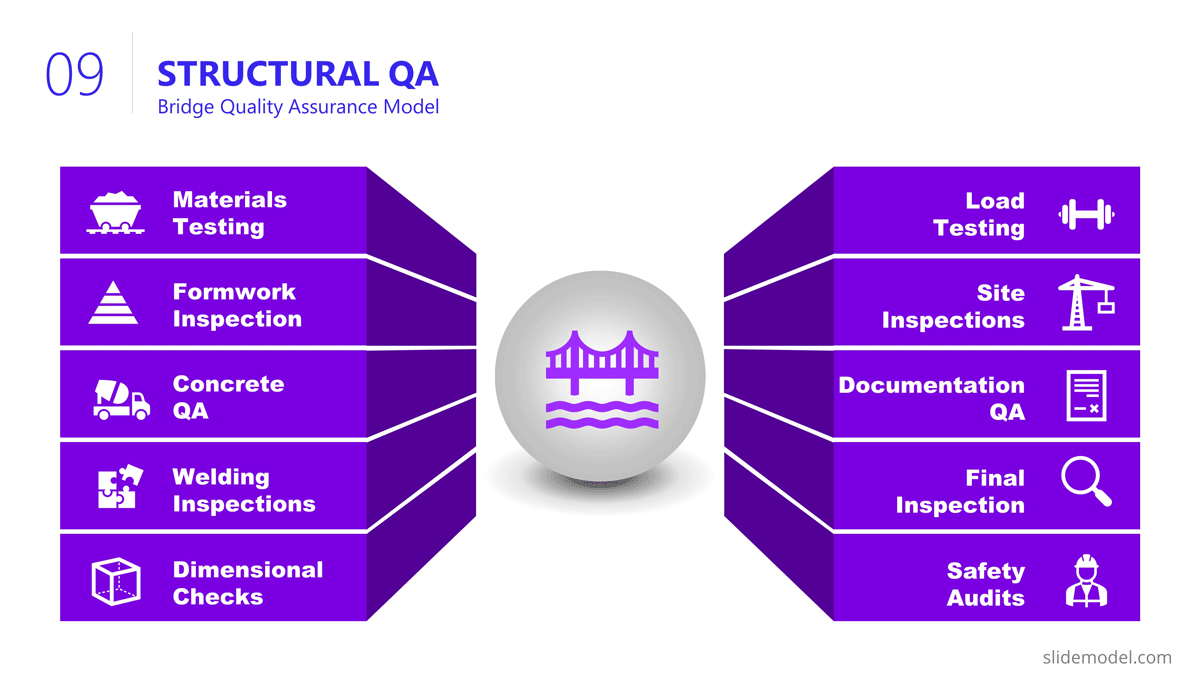
Quality Control
The quality control section of the project presentation may vary depending on the quality process adopted. For large scale companies with a uniform portfolio of projects , it is common to see a continuous improvement quality model, which iteratively builds quality over the different projects (for example software companies) For construction companies like the example, the situation is not different, and the quality control model is aligned with the specific building process model. In this specific case, the project manager is presenting the quality control process to be applied over the BIM model and the Quality Control process to be followed for the physical construction of the bridge:
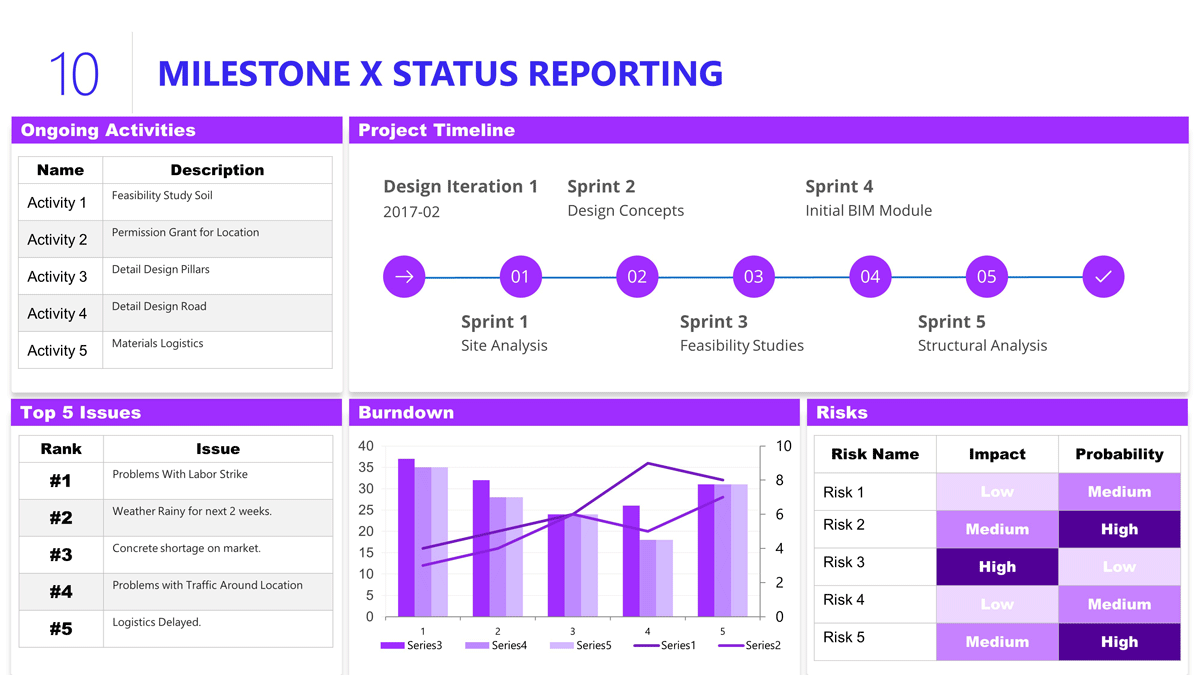
Execution and Monitoring
During the project, several status meetings will be carried out. During the project presentation the manager can establish the pattern to be used along the project.
For this example, we set a basic progress dashboard where the project manager can present :
- Activities
- The current timeline
- Top 5 issues
- Current Burndown
- Top 5 risks.
Conclusion
The art of project presentation goes beyond listing data in random slides. A project presentation is a powerful tool to align stakeholders and foster an environment of trust and collaboration over factual information. While there are many tools available to create presentations, including AI-powered solutions for generating PowerPoint decks with AI, project management presentations often require a more structured and strategic approach to effectively communicate timelines, responsibilities, and progress.
With a structured approach, all members involved in the project design and execution can understand the direction that’s being taken and the importance behind certain decisions. We hope these insights can turn your project into a powerful presentation that inspires and deliver results.