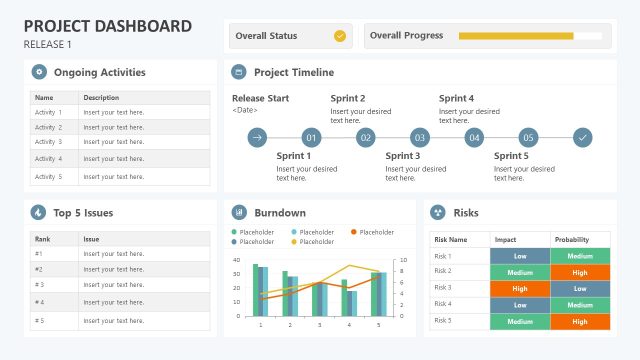
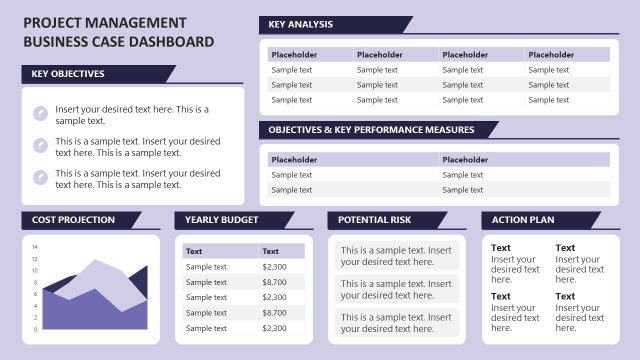
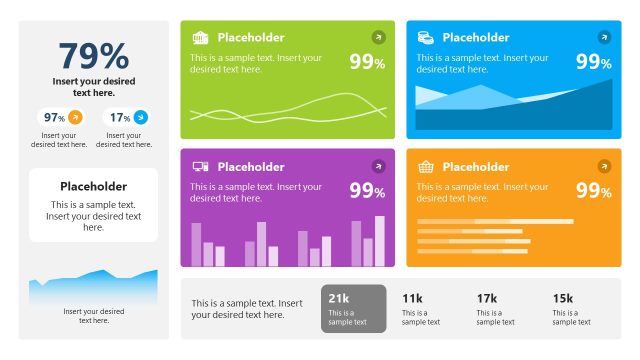
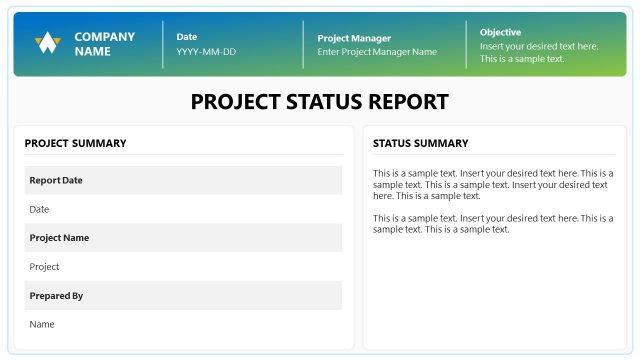
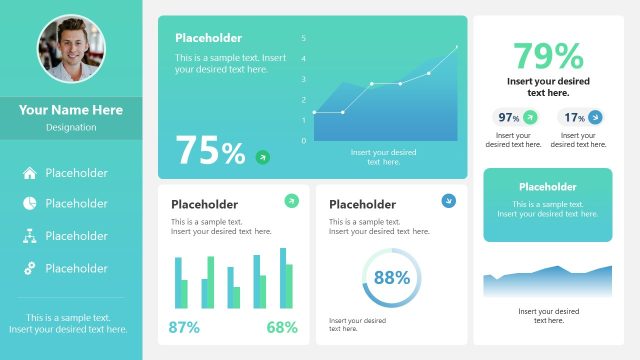
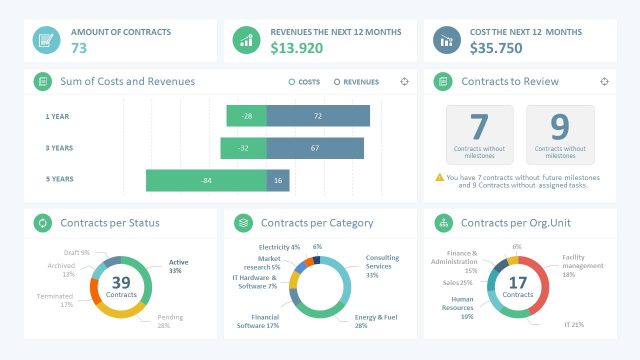
This Project Management Dashboard Template for PowerPoint is a presentation template design that can help you to track your project status. A very useful tool for project managers, business owners, or team leaders. At a glance, it presents project reports like the ongoing tasks, on-hold projects, overdue projects, and more relevant information.
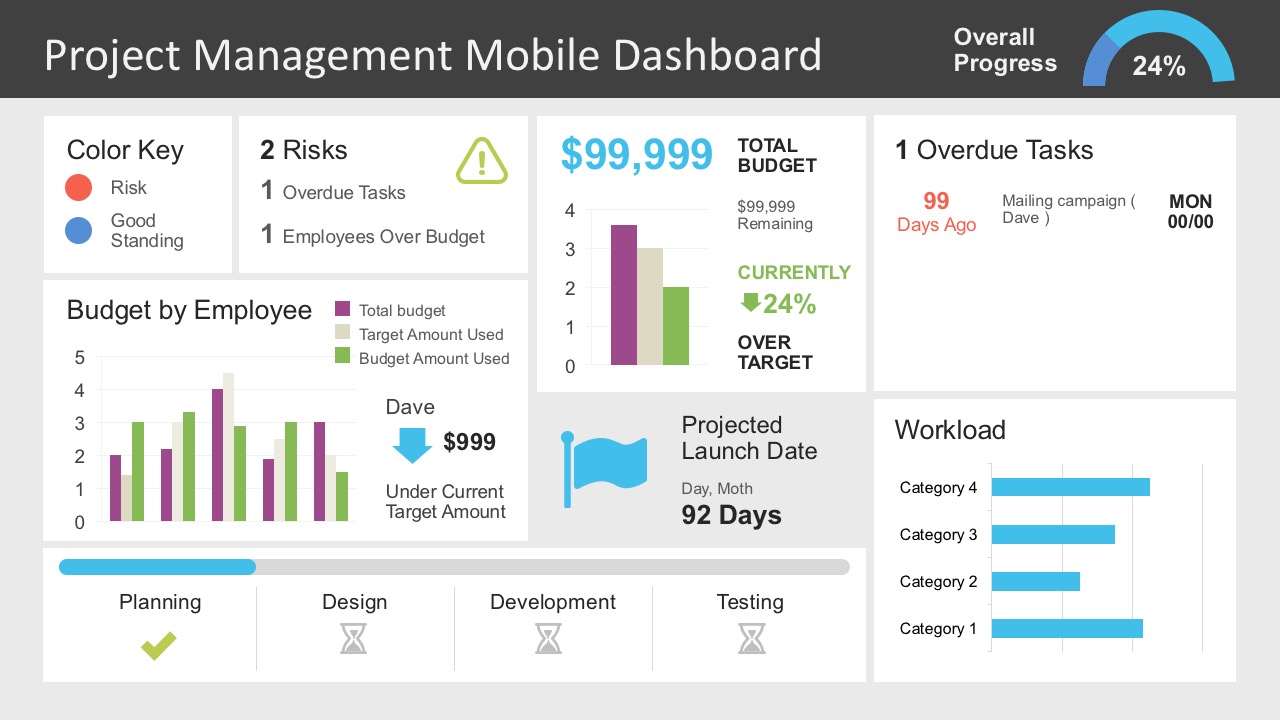
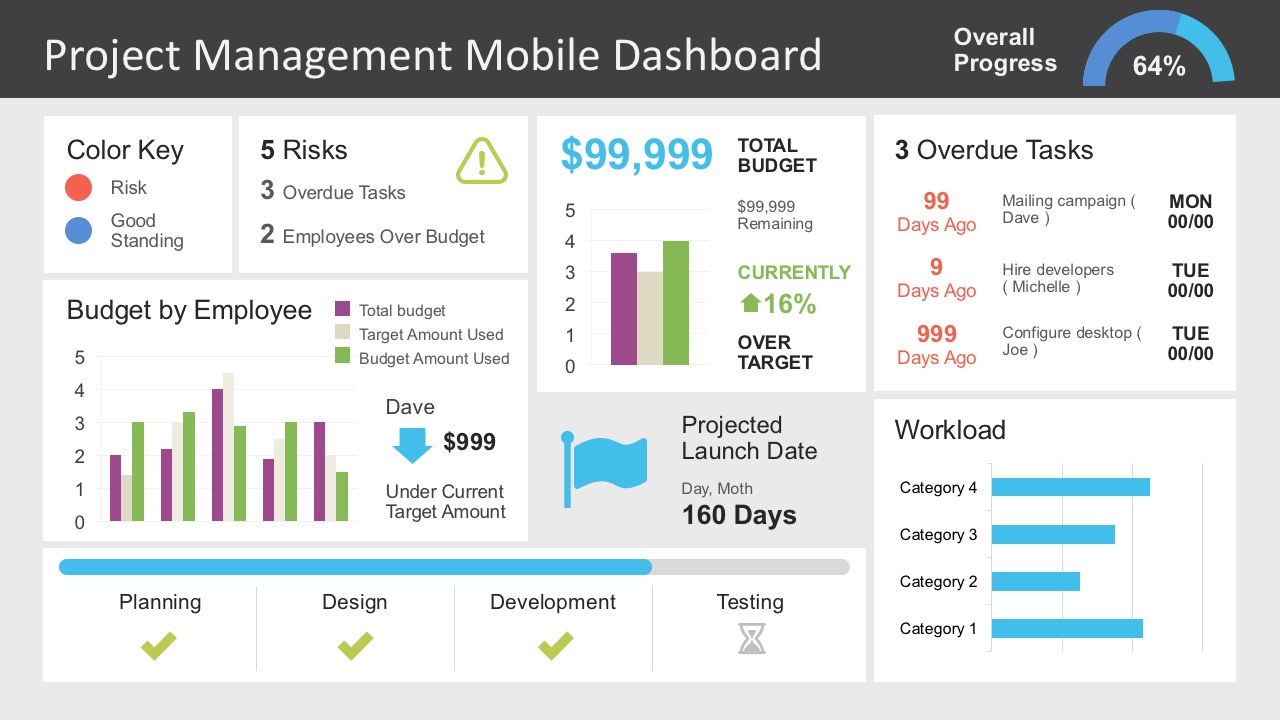
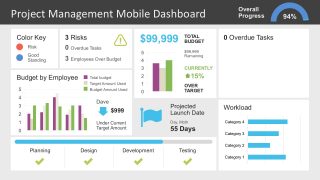
For example, the mobile dashboard displays overall progress that is crucial to a project. Like it includes reports on:
- Stages
- Project Status
- Workload
- Budget by Employee
- Projected Launch Date
Basically, a composition of 3 unique slides that helps to summarize project progress, results, and problems encountered and solved. The users can easily show project status. In general, the dashboard is certainly more like an application that can be used as a weekly progress monitoring. Because the users can edit the figures and data easily.
Also, the dashboard comes in a flat layout with a very good resolution. It contains icons, shapes, numbers, graphics, and charts that are essential in creating a project management PowerPoint presentation. Consequently, all slides are easy to customize using PowerPoint.
The Project Management Dashboard PowerPoint template is ultimately very efficient and specific regarding space utilization and wouldn’t be as stylized if it had to allow for much larger data sets. Hence, perfect for corporate or team presentations. Alternatively, see more dashboards for PowerPoint and project status report PowerPoint templates.
What’s inside this template
Example presentation scenarios
- A project manager can use the progress gauge, risk summary, and overdue task card to brief executives on whether a product launch is on track.
- A team leader can use the workload horizontal bar chart and stage status row to explain current capacity and handoffs during a weekly sprint or operations meeting.
- A finance or operations presenter can use the budget by employee chart and total budget tile to compare spending, target usage, and remaining budget for stakeholders.
- A product manager can use the projected launch date tile, stage row, and risk area to align cross-functional teams before a release milestone.
Features
- 100% editable presentation template
- Compatible with Microsoft PowerPoint and Google Slides
- 16:9 aspect ratio slides
- Scalable vector shapes, icons and illustrations
- Data-driven charts, editable in Microsoft Excel
- AI-Ready for Microsoft Copilot and Claude
- Instant access and download
Frequently asked questions
Q: How should a presenter talk through this dashboard without overwhelming stakeholders?
A: Start with the overall progress gauge because it frames the status immediately. Then move left to right through risks, budget, overdue tasks, workload, and project stages. Treat each tile as one decision point: what changed, why it matters, and what action is needed before the next checkpoint.
Q: Who is this dashboard best suited for, and what meeting does it support?
A: This template works best for project managers, product managers, and team leads who need a short status briefing rather than a full project plan. It is suited to weekly updates, steering committee check-ins, and launch readiness meetings where leaders need progress, budget, risk, workload, and timing on one slide.
Q: Why does the mobile dashboard layout help communicate project health?
A: The mobile dashboard metaphor turns project reporting into a compact control panel. The top bar establishes overall progress, while separate cards isolate risk, budget, overdue work, launch date, and workload. This reduces scanning time and helps the audience compare status signals without reading a long written report.

Project Management Dashboard PowerPoint Template
3-slide presentation template for project dashboards with budget charts and workload tracking
The Project Management Dashboard PowerPoint Template is a 3-slide project status dashboard for Microsoft PowerPoint and Google Slides. It shows progress gauges, budget bar charts, workload horizontal bars, risk summaries, overdue task lists, and stage status rows for project managers, team leads, and business owners reporting project health.
- Category
- Data & Charts
- Rating


 Loading...
- Aspect ratio
- 16:9
- Item ID
- 7379-01
- Colors
 Microsoft PowerPoint
  Microsoft Copilot
  Claude for PowerPoint
 Other formats supported
Subscribe today and get immediate
access to download our PowerPoint templates.