Ask Copilot in PowerPoint to build slides from a report, and you will have a draft in under a minute, but rarely a diagram that looks like a designer built it. Copilot draws from the layouts available in your file, so a report describing a multi-team process or a chain of causes usually comes back as bullet points with a stock image on the side. A better way to work with it is to start with a professionally designed SlideModel template, point Copilot to the document that holds your company data, and ask it to fill existing shapes instead of inventing new ones. This article explains why that pairing works, which prompt to use for four common diagram types, and how to move the finished slides into the presentation decks you already maintain.
Why Copilot Needs a PPT Template to Produce Meaningful Diagrams
The Copilot chat panel in PowerPoint, now called Edit with Copilot (formerly Agent Mode), can reason across a whole file, add and restructure slides, and ground its answers in work files you reference by typing “/” in the prompt box. For anyone who handles long reports, that saves hours of manual summarizing. Our overview of Microsoft Copilot covers the wider feature set if you are new to the assistant.
The weakness shows up in layout. Copilot is good at deciding what to say and far less reliable at deciding what a slide should look like. When it builds slides from scratch, it relies on whatever layouts exist in the slide master. A blank file offers title-and-content layouts, so a quality problem with six contributing causes comes back as six bullets. The text is readable, but the audience loses the relationship between the causes, which is the reason a fishbone diagram exists in the first place.
A SlideModel PowerPoint template changes the starting point. The graphic structure is already built: lanes, bones, milestones, funnel stages, icons, and connectors arranged by designers who considered spacing and reading order. Copilot’s job becomes narrower and better suited to its strengths: extracting the relevant facts from your source and placing them in the right text boxes. You keep the design quality and gain the speed of an assistant that reads a 30-page report in seconds. It also avoids a common complaint about AI-generated PowerPoint presentations: they tend to look alike because they all draw from the same default layouts.
Preparing the Presentation Template and the Source Document
A few preparation steps decide whether Copilot fills the diagram cleanly or rearranges it. First, decide how Copilot will access the source file. If the file lives in OneDrive or SharePoint, type “/” in the Copilot prompt box and pick it from the list; files stored only on your computer will not appear there. If the file sits on your hard drive, attach it with the attach icon in the Copilot pane and send it together with the prompt. Word, Excel, and PDF uploads are enabled by default, although administrators can disable them, and the chat options available in PowerPoint vary by license. Next, open the SlideModel .pptx file in PowerPoint for Microsoft 365 and delete the slide variations you do not plan to use. Leaving every variation in the file invites Copilot to populate slides you will throw away.
Then check what kind of source file you have. Microsoft’s documentation confirms support for Word files on all Copilot plans and for PDFs with a Microsoft 365 Copilot work license. You can reference Excel workbooks in the chat as work content, but extraction is more dependable when the data sits in a clearly labeled table. Copilot also limits how many words it processes per prompt, so a trimmed source beats a 200-page annual report.
Finally, count the placeholders. Every template has a fixed number of shapes. Knowing that number lets you tell Copilot exactly how many items to extract, which is the most effective way to keep the diagram intact. In our case studies, the prompts below all follow one pattern. They name the source file, state the number of items, set a word limit per text box, forbid layout changes, and ask Copilot to flag missing information instead of inventing it.
Populating Each SlideModel Template, Case by Case
Each example below pictures a manager with a SlideModel template open in PowerPoint and a company document saved in either OneDrive or locally. In each case, select the target slide in the thumbnail pane before sending the prompt, so Copilot edits that slide instead of creating a new one.
Swimlane Flowchart Template: Mapping an Order Fulfillment SOP
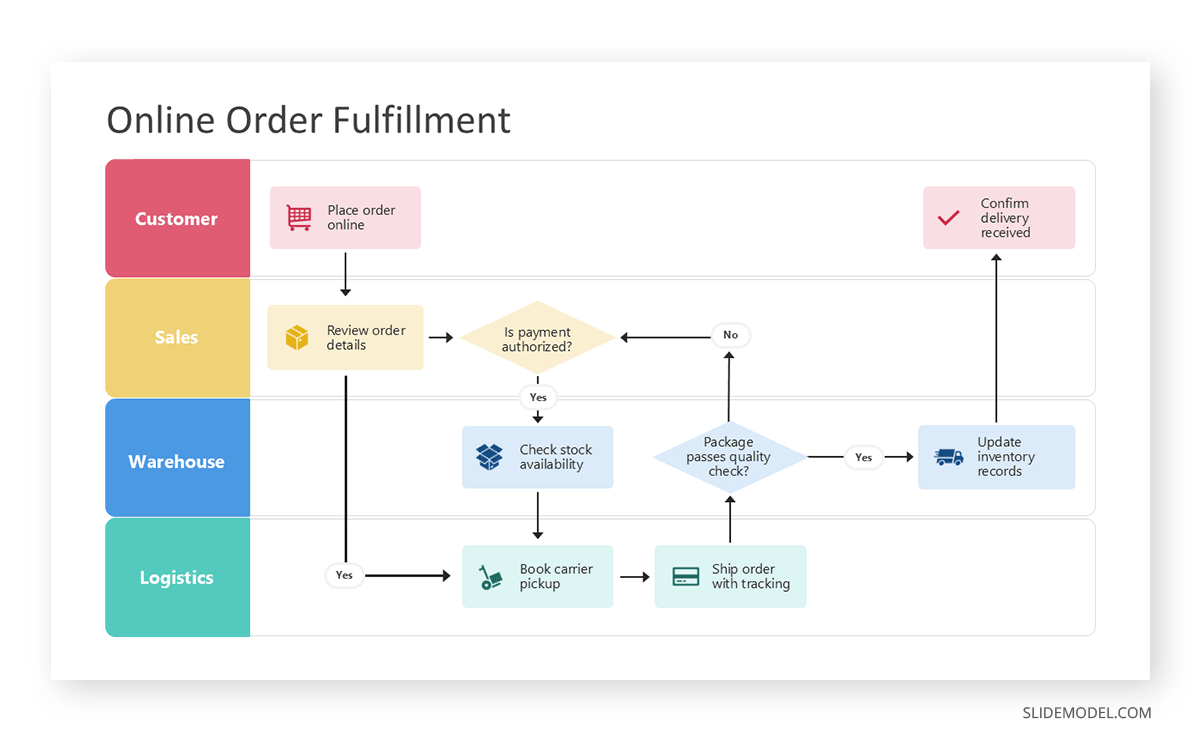
The Swimlane Flowchart PowerPoint Template arranges process steps in horizontal lanes, one per team or role, with Yes and No decision points and icons for a shopping cart, a payment card, a packing box, and a delivery truck. The source here is an order fulfillment standard operating procedure (SOP) written in Word. If you need a refresher on how lanes and handoffs should read, see our article on swimlane diagrams.
Both prompt versions below give the same instructions. The first references a file stored in OneDrive or SharePoint, and the second assumes you attach the file from your computer before sending.
Populate the selected slide using /Order-Fulfillment-SOP.docx. Replace the slide title with the process name used in the SOP. The slide has four lanes: rename each lane label with one department from the SOP, such as Customer, Sales, Warehouse, or Logistics. Fill the nine 'Insert your desired text here.' boxes with process steps in the order the SOP describes, reading left to right, and only write a step in a box whose lane matches the department that performs it. Use five words maximum per box. Keep the YES and NO labels and phrase the step before each decision as a yes/no question. Do not add, delete, move, or resize any shape, icon, connector, or arrow. If the SOP has more than nine steps, merge minor ones. If it names more or fewer than four departments, tell me before making changes.
Populate the selected slide using the SOP document I attached (Order-Fulfillment-SOP.docx). Replace the slide title with the process name used in the SOP. The slide has four lanes: rename each lane label with one department from the SOP, such as Customer, Sales, Warehouse, or Logistics. Fill the nine 'Insert your desired text here.' boxes with process steps in the order the SOP describes, reading left to right, and only write a step in a box whose lane matches the department that performs it. Use five words maximum per box. Keep the YES and NO labels and phrase the step before each decision as a yes/no question. Do not add, delete, move, or resize any shape, icon, connector, or arrow. If the SOP has more than nine steps, merge minor ones. If it names more or fewer than four departments, tell me before making changes.
Fishbone Diagram Template: Turning an Incident Report into a Root Cause View
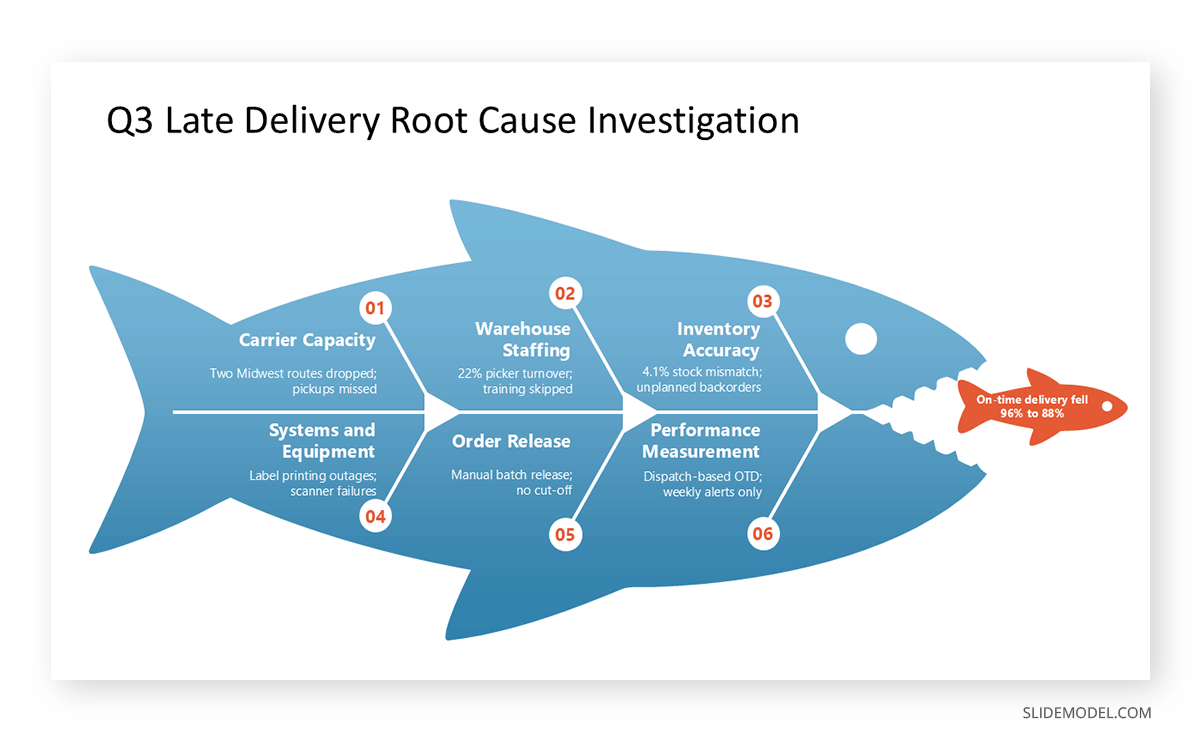
The Fishbone Diagram PowerPoint Template offers six numbered bones, each with a heading and a short description, plus a head shape that holds the problem statement. It works well for post-incident reviews and quality investigations. The source here is a PDF incident report describing a spike in late deliveries during the third quarter. For background on the method, our guide on how to make a fishbone diagram in PowerPoint explains the categories most teams use.
Read /Q3-Late-Delivery-Incident-Report.pdf and populate the selected slide. Replace the slide title with a short investigation title. In the fish head, write the problem statement in eight words or fewer, including the metric, for example, 'On-time delivery fell from 96% to 88%'. Group the contributing causes in the report into six categories. For each numbered bone, use the category as the heading (3 words or fewer) and the two most significant causes as the description (12 words or fewer). Put the cause the report ranks as most severe on bone 01. Use only causes stated in the report. If fewer than six categories apply, label the remaining bones 'Other factors'. Keep every shape and number as it is.
Read the incident report I attached (Q3-Late-Delivery-Incident-Report.pdf) and populate the selected slide. Replace the slide title with a short investigation title. In the fish head, write the problem statement in eight words or fewer, including the metric, for example, 'On-time delivery fell from 96% to 88%'. Group the contributing causes in the report into six categories. For each numbered bone, use the category as the heading (3 words or fewer) and the two most significant causes as the description (12 words or fewer). Put the cause the report ranks as most severe on bone 01. Use only causes stated in the report. If fewer than six categories apply, label the remaining bones 'Other factors'. Keep every shape and number as it is.
After Copilot fills the slide, check each cause against the page of the report it came from. If your organization already uses the 6M structure (Man, Machine, Method, Material, Measurement, Mother Nature), name those categories in the prompt so the result matches previous reviews. The “Other factors” instruction in the prompt keeps Copilot from stretching the evidence to fill all six bones. A fishbone slide pairs well with a 5 Whys root cause analysis, and you can ask Copilot to draft that follow-up slide from the same report once the diagram is approved.
4-Step Growth Roadmap Journey Template: Converting a Strategy Plan into Milestones
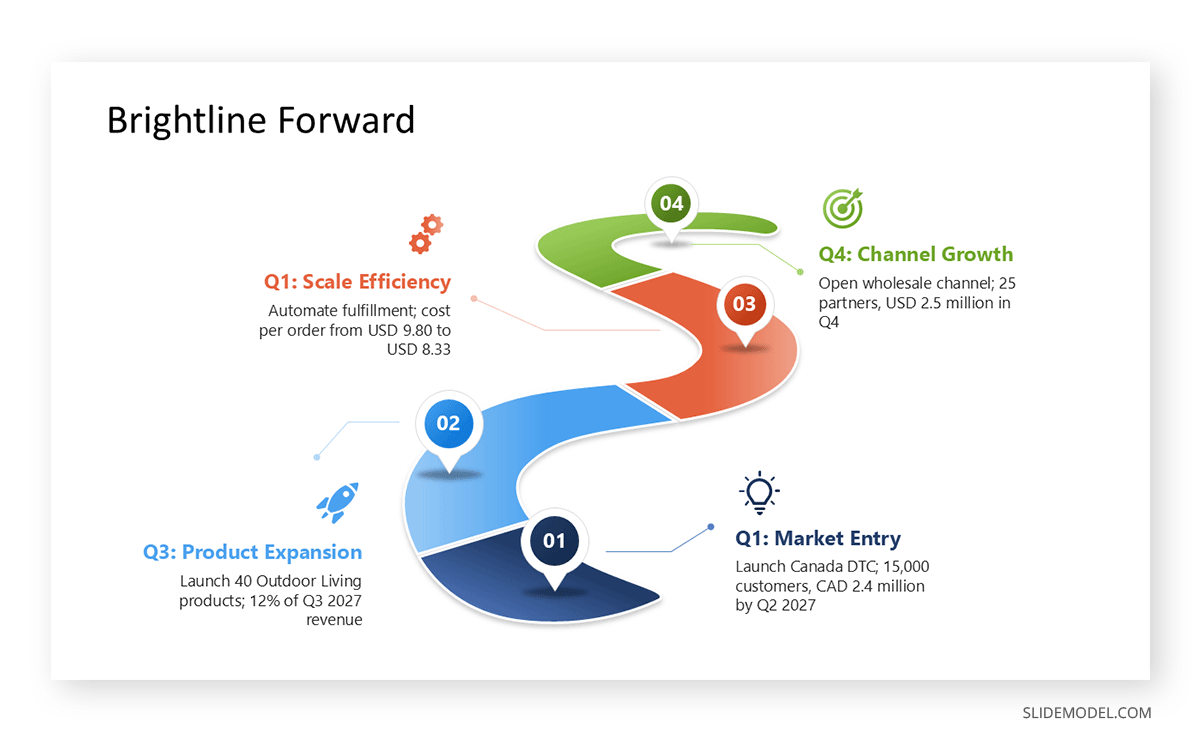
The 4-Step Growth Roadmap Journey PowerPoint Template shows four numbered steps along a path, each with a title and a short supporting text. The source is a Word document containing an 18-month growth strategy. Our roadmap presentation guide covers how much detail each milestone should carry.
Using /2027-Growth-Strategy.docx, populate the selected slide. Replace the slide title with the name of the growth plan. Identify the four phases of the plan in chronological order and assign them to steps 01 to 04, with 01 as the earliest. For each step, replace 'Placeholder' with a title of three words or fewer that includes the quarter, for example, 'Q1: Market Entry', and replace the sample text with the phase's main objective and one measurable target in 12 words or fewer. Use figures exactly as they appear in the document. If the plan has more than four phases, tell me which ones you would combine before making changes. Do not change the layout or the step numbers.
Using the strategy document I attached (2027-Growth-Strategy.docx), populate the selected slide. Replace the slide title with the name of the growth plan. Identify the four phases of the plan in chronological order and assign them to steps 01 to 04, with 01 as the earliest. For each step, replace 'Placeholder' with a title of three words or fewer that includes the quarter, for example, 'Q1: Market Entry', and replace the sample text with the phase's main objective and one measurable target in 12 words or fewer. Use figures exactly as they appear in the document. If the plan has more than four phases, tell me which ones you would combine before making changes. Do not change the layout or the step numbers.
Strategy documents rarely come divided into exactly four phases. If yours has six, the prompt asks Copilot to propose which phases to combine before touching the slide, so you can reply with a decision such as “combine the two expansion phases into step 03”. After population, check that the text fits. When a box overflows, send a follow-up like “Shorten the description in step 02 to 10 words” instead of resizing the shape, which would break alignment along the path.
4-Stage Content Marketing Funnel Template: Summarizing Campaign Data from Excel
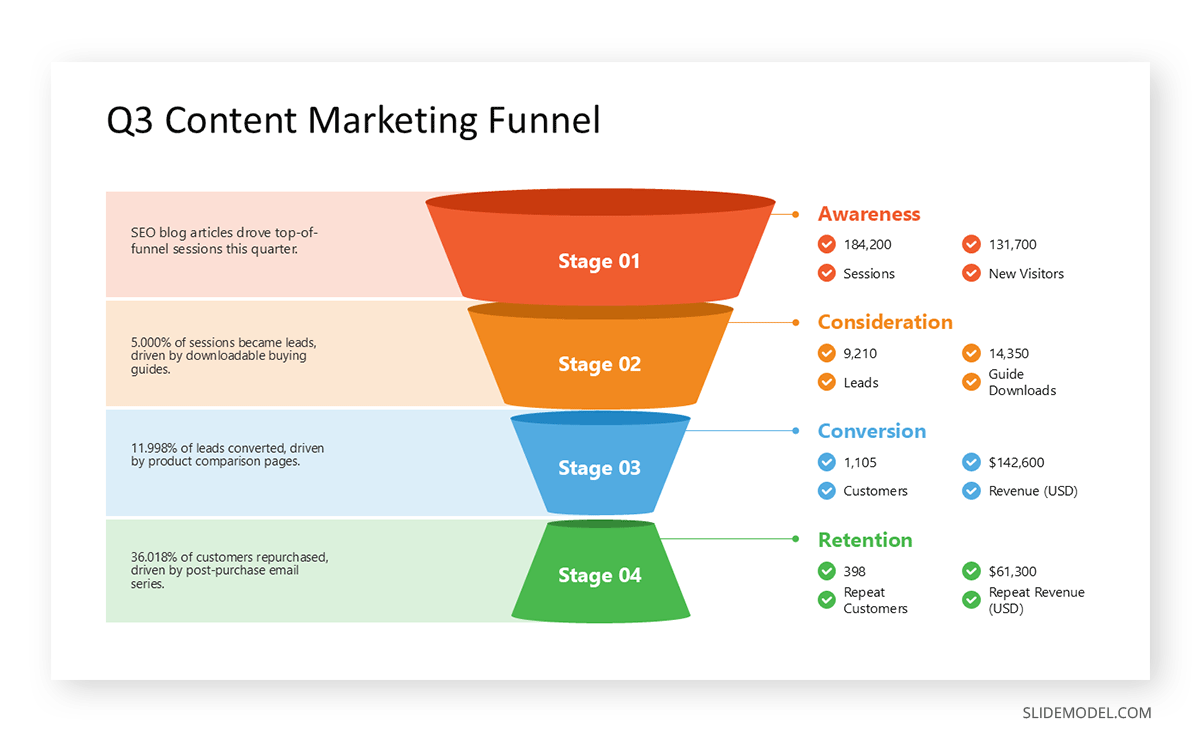
The 4-Stage Content Marketing Funnel PowerPoint Template presents four stages, each with a heading, a short description, and four small boxes arranged in a grid that suit two metric pairs, while the “Stage 01” to “Stage 04” labels sit in the center of the funnel. In this example, the source is an Excel workbook listing sessions, leads, marketing qualified leads, and customers by channel. Our sales funnel guide explains how stage definitions usually map to these metrics.
Using the 'Q3 Funnel' table in /Content-Performance-Q3.xlsx, populate the selected slide. Replace the slide title with 'Q3 Content Marketing Funnel'. Keep the 'Stage 01' to 'Stage 04' labels. For each stage, write the stage name in the large heading box: Awareness, Consideration, Conversion, and Retention, in that order. In the four small boxes of each stage, show two metrics from the table as value and label pairs, for example, '184,200' and 'Sessions'. Replace the sample text of each stage with the conversion rate from the previous stage and the content type that drove it, in 12 words or fewer. Do not round figures, show your conversion rate calculations in the chat so I can check them, and do not modify the funnel shapes.
Using the 'Q3 Funnel' table in the workbook I attached (Content-Performance-Q3.xlsx), populate the selected slide. Replace the slide title with 'Q3 Content Marketing Funnel'. Keep the 'Stage 01' to 'Stage 04' labels. For each stage, write the stage name in the large heading box: Awareness, Consideration, Conversion, and Retention, in that order. In the four small boxes of each stage, show two metrics from the table as value and label pairs, for example, '184,200' and 'Sessions'. Replace the sample text of each stage with the conversion rate from the previous stage and the content type that drove it, in 12 words or fewer. Do not round figures, show your conversion rate calculations in the chat so I can check them, and do not modify the funnel shapes.
Spreadsheet data calls for the most careful review of the four cases. Asking Copilot to show its calculations in the chat makes it easy to verify the arithmetic against the workbook before presenting, since a single wrong percentage undermines the whole slide. If the workbook has several sheets, name the sheet and table in the prompt. If Copilot cannot read the workbook through “/”, try the upload version of the prompt, or paste the table into a Word file and use that instead. Stage 01 has no previous stage, so expect its description to name only the content type. Delete any placeholder Copilot leaves empty so no sample text reaches your audience.
Integrating the Generated Slides into Existing Presentation Decks
A populated diagram usually needs to land inside a quarterly business review or a client presentation deck that already exists. The cleanest method is Reuse Slides: open the destination presentation, go to Home > New Slide > Reuse Slides, browse to the populated template, and insert the slides you need. Check “Keep source formatting” to preserve the template’s colors and fonts. Leave it unchecked if you want the diagram to adopt the destination theme, but preview the result, since theme colors can recolor funnel stages or lanes and reduce contrast. Our guide on how to combine PowerPoint files covers this and the copy-paste alternative.
Keeping source formatting also imports the template’s layouts, which can clutter the slide master. Open View > Slide Master afterward and delete the unused ones, as explained in our article on how to work with Slide Master in PowerPoint.
Then put Copilot to work inside the destination file. A prompt such as “Review slides 8 to 11 and make the terminology consistent with the rest of the presentation” catches mismatches like “customers” on one slide and “clients” on another. You can also ask for speaker notes explaining each lane or milestone in two sentences, or run the built-in Review this presentation skill to spot a diagram that feels out of place in the storyline. Finally, check every figure against the source document one more time. A diagram full of company data needs the same scrutiny as any other part of your data presentation.
FAQs
Does Copilot in PowerPoint work with SlideModel templates?
Yes. SlideModel templates are standard .pptx files, so Copilot can read and edit their text boxes like any other presentation. You need PowerPoint for Microsoft 365 (desktop or web) and a plan that includes Copilot.
Which Copilot plan do I need to reference PDF files?
According to Microsoft’s documentation, personal Copilot plans can create content from a single Word file, while a Microsoft 365 Copilot work license supports PDF files, including encrypted ones.
Can Copilot read data directly from an Excel workbook?
Yes, either by referencing a workbook stored in OneDrive or SharePoint or by uploading it with the prompt; Microsoft supports Excel files by default. Clearly labeled tables give the most reliable results.
Why did Copilot change the layout of my diagram?
Copilot tends to redesign slides when the prompt leaves room for it. State explicitly that shapes and connectors must stay where they are, and select the target slide before sending the prompt.
How do I stop Copilot from inventing data?
Tell Copilot to use only information stated in the referenced file and to report gaps instead of filling them. Then verify every figure against the source before presenting.
Can I populate several template slides with one prompt?
You can, but results are more predictable when you work one slide at a time. A single long prompt increases the chance that Copilot mixes instructions across diagrams.
What should I do if the text overflows a shape?
Send a follow-up prompt asking Copilot to shorten that specific text box to a set number of words. Avoid resizing SlideModel shapes, since their proportions keep the diagram aligned and balanced.
Is my company data safe when Copilot reads it?
With a work or school account, Microsoft 365 Copilot processes data within the Microsoft 365 service boundary under your organization’s privacy and security policies. Confirm with IT which files you may reference.
Can I follow the same process in Google Slides?
Copilot is only available in Microsoft apps. SlideModel templates are also available for Google Slides, where Gemini offers a comparable workflow, though the prompts and file-referencing method differ.
Should I use a Brand kit together with SlideModel templates?
A Brand kit helps Copilot apply your logos and brand colors. If your company colors differ from the template, ask Copilot to apply brand colors to the diagram shapes after population, and review contrast before sharing.
Final Words
Copilot in PowerPoint is strongest when it reads and summarizes, and weakest when it designs a slide from nothing. SlideModel templates cover that gap, leaving Copilot to place your company’s data in the right shapes. The four cases above share one method: a prepared template paired with a clean source document, and a prompt that fixes the number of items and word limits while leaving the layout untouched. With that method in place, a swimlane, fishbone, roadmap, or funnel slide can go from a blank template to a finished diagram in a few minutes, ready to join the slide deck your team presents next.