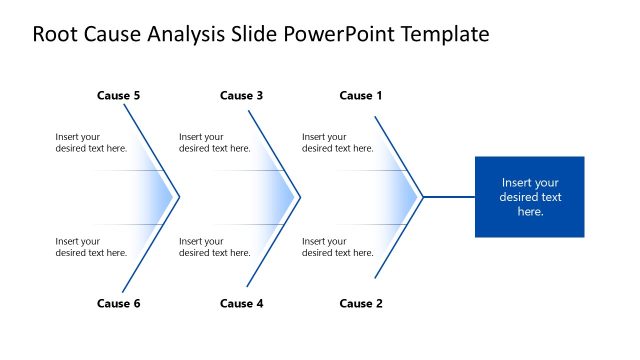
Visualize the root cause analysis results and the causing factors with our editable Fishbone Diagram PowerPoint Template. A fishbone diagram shows a central spine with branches. When a project is not completed on time or the objectives are not met, it is an alarming situation that organizations must resolve promptly. To achieve an effective solution, strategists need to identify the root cause of the issue. Root cause analysis helps professionals identify the factors that cause the problem. They go deeper into the scenario to map the exact component. A fishbone diagram is useful for visualizing the complete process in an understandable format. Marketing managers can showcase their corresponding RCA results and pinpoint issues in ads or audience targeting during meetings using this fishbone diagram. In performance review presentations, strategy leaders can showcase the six factors that reduce system productivity.
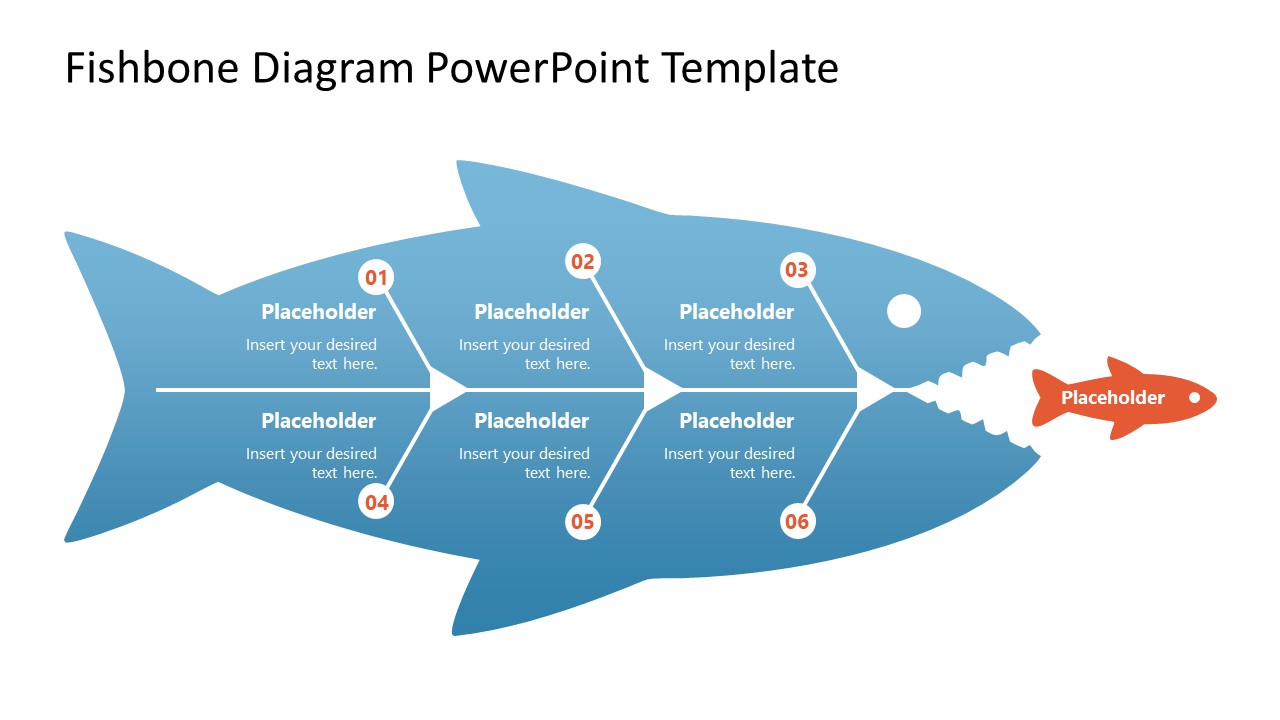
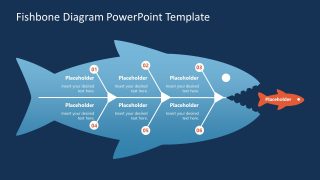
The Fishbone Diagram PowerPoint Template features a large fishbone diagram with six branches, with a smaller red fish illustrating the actual problem or final effect. Quality managers can add custom text to the placeholders given with each branch of the fishbone diagram. They can discuss the factors contributing to the manufacturing defect during the stakeholder presentation.
The fishbone diagram enables project managers to communicate vague problem statements into clear, actionable solutions in their team presentations. All components in the slide template are editable in Google Slides and other versions of PowerPoint. The fishbone diagram template has two slides with the same diagram but different background colors(white and dark).
Download the fishbone diagram template to present the possible reasons affecting business performance. Additionally, you can learn how to make a fishbone diagram in PowerPoint, and we have other fishbone diagram templates for Microsoft PowerPoint & Google Slides so you can select the one that matches your theme.
What’s inside this template
Example presentation scenarios
- A quality manager can use the six-branch fishbone diagram to explain possible causes of a production defect and guide stakeholders toward the most likely source.
- A project manager can present the red final effect fish as a missed deadline or delivery issue, then map process, people, tool, and communication causes in the branch placeholders.
- A marketing manager can use the numbered cause markers to discuss why a campaign underperformed and separate targeting, channel, message, budget, timing, and measurement factors.
- An operations leader can use the dark-background slide in an executive review to summarize productivity blockers while keeping the discussion focused on one clear business effect.
Features
- 100% editable presentation template
- Compatible with Microsoft PowerPoint and Google Slides
- 16:9 aspect ratio slides
- Scalable vector shapes, icons and illustrations
- AI-Ready for Microsoft Copilot and Claude
- Instant access and download
Frequently asked questions
Q: How should a presenter structure the root cause conversation with this template?
A: Start by naming the final effect in the red fish so the audience agrees on the problem being explained. Then move left across the fishbone and introduce each numbered cause area one at a time. Keep each branch label short, use the smaller text for evidence or examples, and finish by ranking which causes need action first.
Q: Who is this fishbone diagram best suited for?
A: This template fits quality, operations, project, and strategy presenters who need to turn a broad problem statement into a clear set of possible causes. It works best in review meetings, workshops, and problem diagnosis sessions where the audience must see how several factors contribute to one visible business issue.
Q: Why does the fishbone metaphor help explain cause and effect?
A: The fishbone metaphor gives the problem a visible direction: all branches point toward one final effect. That shape prevents the discussion from becoming a loose list of complaints. The six numbered branches create order, while the red fish at the mouth keeps attention on the outcome that the team is trying to explain.

Fishbone Diagram PowerPoint Template
2-slide presentation template for fishbone root cause analysis and problem solving diagrams
The Fishbone Diagram PowerPoint Template is a 2-slide diagram template for root cause analysis, problem statements, and cause and effect discussions. It includes a six-branch fishbone diagram, editable numbered cause markers, and a final effect fish label in light and dark versions for PowerPoint and Google Slides.
- Category
- Diagrams
- Rating

 Loading...
- Aspect ratio
- 16:9
- Item ID
- 23653-01
- Colors
 Microsoft PowerPoint
  Microsoft Copilot
  Claude for PowerPoint
 Other formats supported
Subscribe today and get immediate
access to download our PowerPoint templates.