“Your brand is the single most important investment you can make in your business,” said Forbes editor-in-chief Steve Forbes. Every marketer would agree. When you have good branding, success flows effortlessly, as if cash is drawn magnetically to your business. But here’s the secret: success comes to those who truly know their brand.
Developing a brand positioning strategy is far more than simply imagining the impression you want to make on customers. It requires a deep awareness and understanding of both the marketplace and the consumers’ impression of your brand. This is what a perceptual map will do for you.
Table of Contents
- What Is a Perceptual Map
- Importance of Perceptual Mapping
- How to Make a Perceptual Map
- Implementing a Perceptual Map: Harley Davidson Case Study
- Recommended Templates for Creating Perceptual Maps
- Conclusion
What Is a Perceptual Map
A perceptual map, also called perceived position or position map, is a competitive analysis framework that enables marketers to visually assess the positioning of their brands against their competitors concerning specific attributes.
The components of the framework look simple. It has vertical and horizontal axes representing the dimension you want to measure.
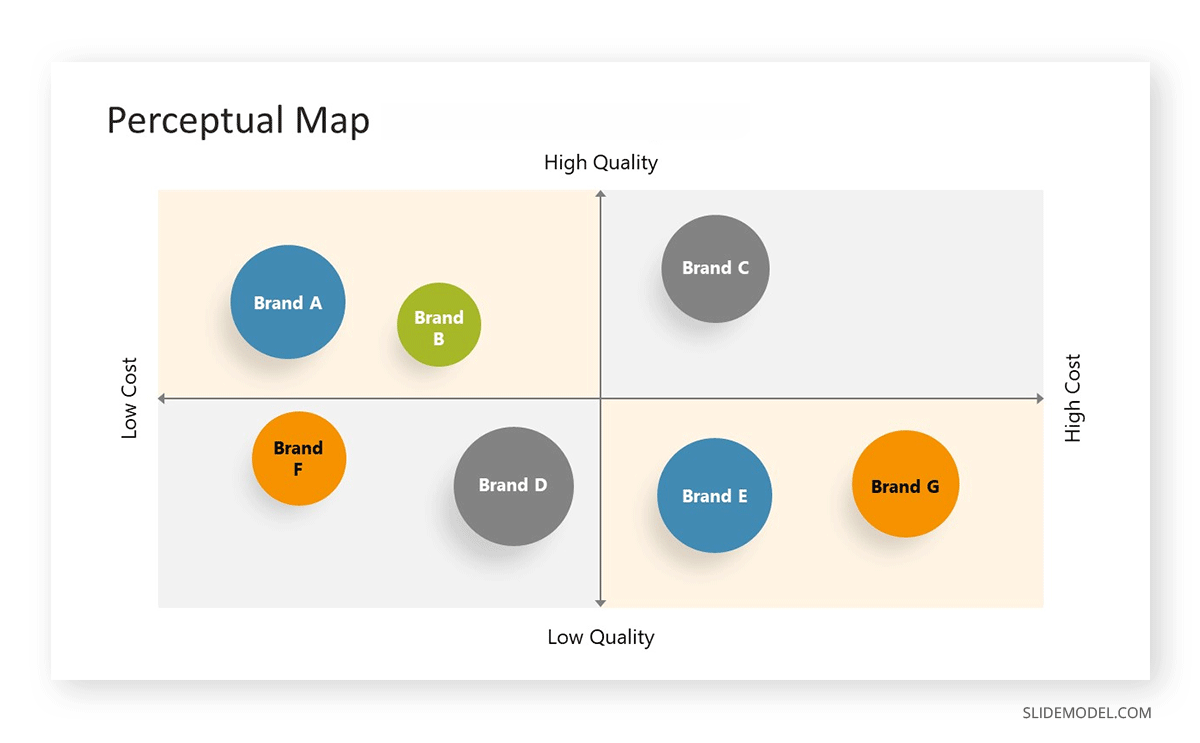
For example, the horizontal axis could represent the price range, with low prices on the left and high prices on the right. The vertical axis could represent quality, with low quality at the bottom and high quality at the top.
The position of a product or brand on the map determines how consumers perceive or rate it on these dimensions.
Importance of Perceptual Mapping
For many businesses, perceptual mapping is a fact-based foundation for developing business strategies and marketing decisions. It can make a real difference in your business. It can help you make smart choices that drive growth or avoid making bad decisions that harm your company.
1. It Reveals Customer Perception
Perceptual mapping aims to reveal how customers and prospects view your existing business, products, or services. This knowledge is crucial for identifying strengths and weaknesses in your business that you can capitalize on or further hone.
For example, suppose a restaurant’s perceptual map shows that customers perceive it as having high-quality food and excellent service.
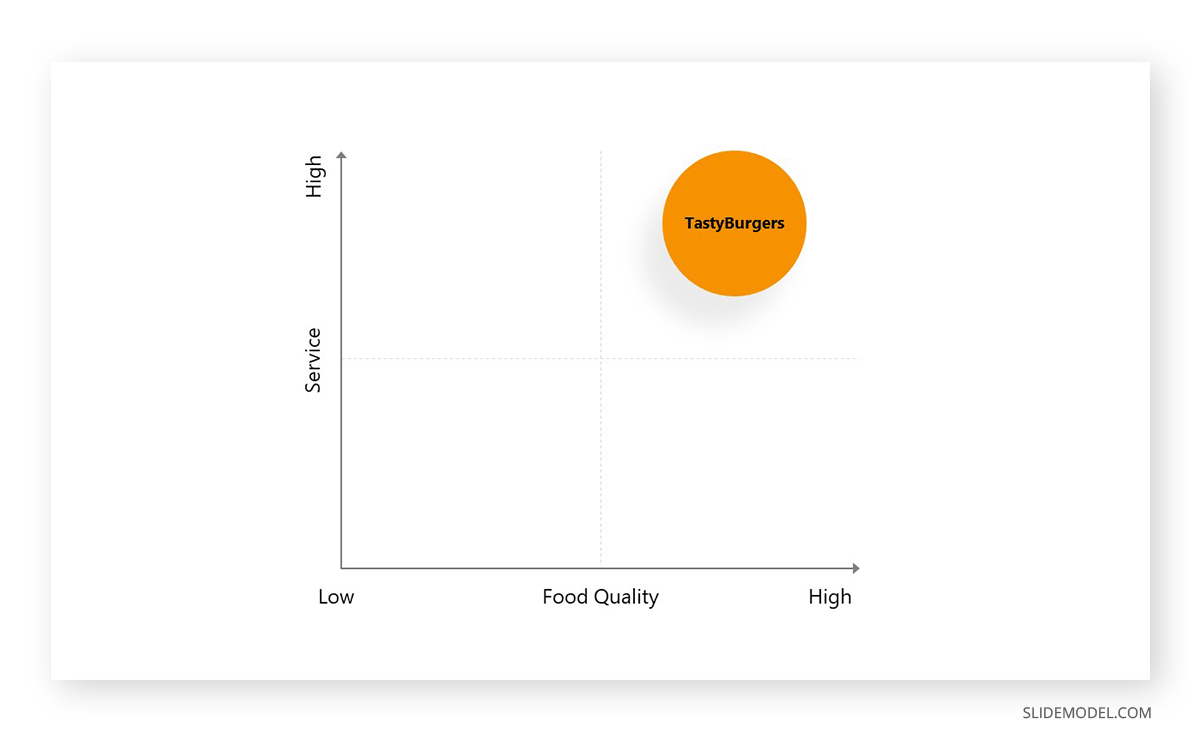
In that case, the business can focus on further enhancing these strengths and promoting them to attract more customers who value these attributes, like by tailoring the marketing strategy.
2. It Reveals Who Your Direct Competitors Are
Competition can be scary, especially if you don’t know who you are up against. This is the beauty of a perceptual map. It helps businesses understand how their products or services are positioned relative to competitors in customers’ minds. This knowledge is invaluable for developing a competitive advantage and crafting a unique value proposition that sets your business apart.
3. It Identifies Opportunities for Product Development
A perceptual map goes beyond being a visual representation of your market position. It offers valuable insights that can inform strategic decision-making. By analyzing the map, businesses can uncover important information about their market and competition, allowing them to identify gaps, untapped opportunities, and areas of differentiation.
More importantly, it helps create a game plan that aligns your brand positioning, marketing messaging, and overall business strategy with the desired perception you want to establish among your target audience. A well-crafted game plan based on perceptual mapping can increase your chances of success and market penetration.
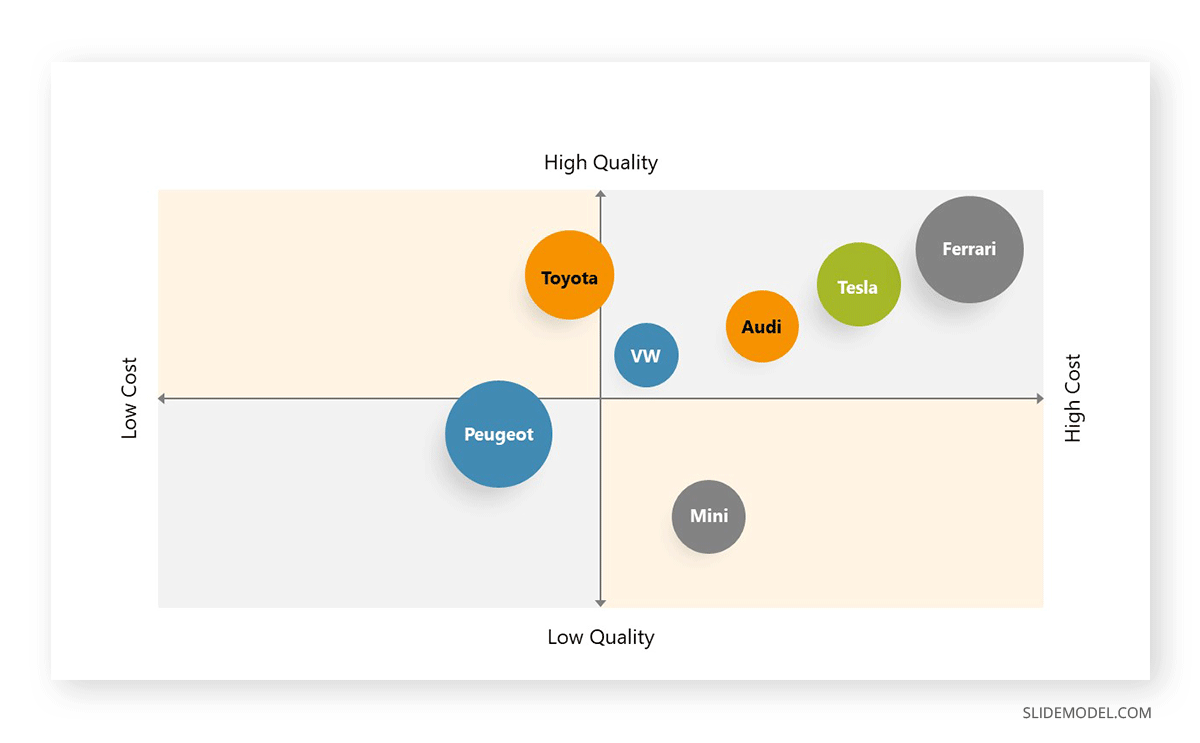
Tesla is a textbook example of this approach. Before electric cars, there were limited options for vehicles that utilize sustainable energy. The company was able to fill this gap and positioned itself as a technologically-advanced and environmentally-friendly car manufacturer. Suppose we map the current market for automotive companies. In that case, Tesla comes close to legends like Ferrari and even ranks higher than Audi in terms of quality but also falls into the “luxury” car category. Other competitors like Toyota are valued in similar quality terms, but their product line is targeted to the average consumer, hence decreasing the cost for the same market.
4. It Helps Allocate Your Marketing Resources
One of the most valuable aspects of perceptual mapping is its ability to help businesses better allocate their marketing resources. By analyzing the map, businesses can identify clusters or areas on the map where their target audience is concentrated. These segments may represent customers more likely to be interested in their products or services based on their positioning and desired perception.
Understanding this allows you to focus your marketing efforts, tailor your messages, and allocate resources more effectively to reach customers and establish a strong foothold in the market.
How to Make a Perceptual Map
Before delving into the process of plotting a perceptual map, conducting thorough research and gathering relevant information is a vital part of the preparation. This initial step ensures that the result accurately reflects customer sentiments and provides valuable insights.
1. Identify the Relevant Attributes Important to Your Customers
To effectively utilize perceptual mapping, you must determine the key factors that matter to your customers when purchasing. These could be price, quality, convenience, or other factors influencing their buying decisions.
It’s important to take this step with a customer-centric perspective. Forget any notion you have about your brand and shift your focus to your customers’ motivations when purchasing. This way, you can better align your brand with their expectations.
You may use surveys to gather information about the attributes customers consider. Ask open-ended questions to encourage customers to provide their perspectives and priorities. You may also utilize a rating scale to determine the importance of a given attribute in their decision-making.
Based on the attributes that come up, choose two dimensions that will represent the axes of your perceptual map.
2. Identify Your Competitors
Competitive research is the backbone of a strong marketing strategy. It becomes challenging to distinguish yourself and your product from the crowd without the ability to identify and analyze your competitors.
Talk to your sales team and find out key competitors in your industry. They directly interact with customers and can provide valuable insights about competitors they frequently encounter during sales. You may also solicit customer feedback to find out the brands they consider other than yours. They might surprisingly reveal competitors that are not even on your radar.
3. Conduct a Survey
Next, collect data on how customers perceive different brands or products on the selected dimensions, including yours.
Create a rating question that allows respondents to rate the attributes of each brand or product on a common scale. This step is crucial as it allows for meaningful comparison and plotting of data points on the perceptual map. For example, you may ask customers to rate the affordability of different brands on a scale of -5 to +5, with -5 being the most affordable and +5 being the most expensive. Ensure that the scale is clear and consistent across all attributes and brands.
4. Plot the Data
Once you’re done with the market survey, plot the results on your chosen perceptual map template. Each data point represents a specific brand or product and its position on the identified dimensions. Ensure that the data points are accurately plotted according to the scaled values.
For example, if you are mapping price and quality in a -5 to +5 scale, you may assign a range of low (-5) to high (+5) for each attribute. Then, place each competitor according to its scaled values on the respective axes. If Brand A has a price rating of -3 and a quality rating of +2, plot its data point at the corresponding coordinates (-3, +2) on the map. Repeat this process for all brands or products included in the survey.
5. Take Action
Finally, the most important step of the perceptual mapping process – taking action. Once you have gathered insights from the perceptual map, leveraging those insights effectively is essential.
Is your brand in a favorable position? Even so, you have to make a conscious effort to keep this position. The market can sharply turn, and competitors can outplay you anytime. So, leverage your strengths to differentiate your brand further and enhance customer loyalty.
Do your target customers have a different impression of your brand than you desire? This indicates a discrepancy that needs to be addressed. You must refine your brand messaging, customer experience, or other elements to bridge the gap and align with your desired brand image.
Are there any empty quadrants? This could indicate a market segment with no competitors or limited presence. Assess whether it’s a viable opportunity for you to position your brand uniquely and cater to unmet customer needs.
Implementing a Perceptual Map: Harley Davidson Case Study
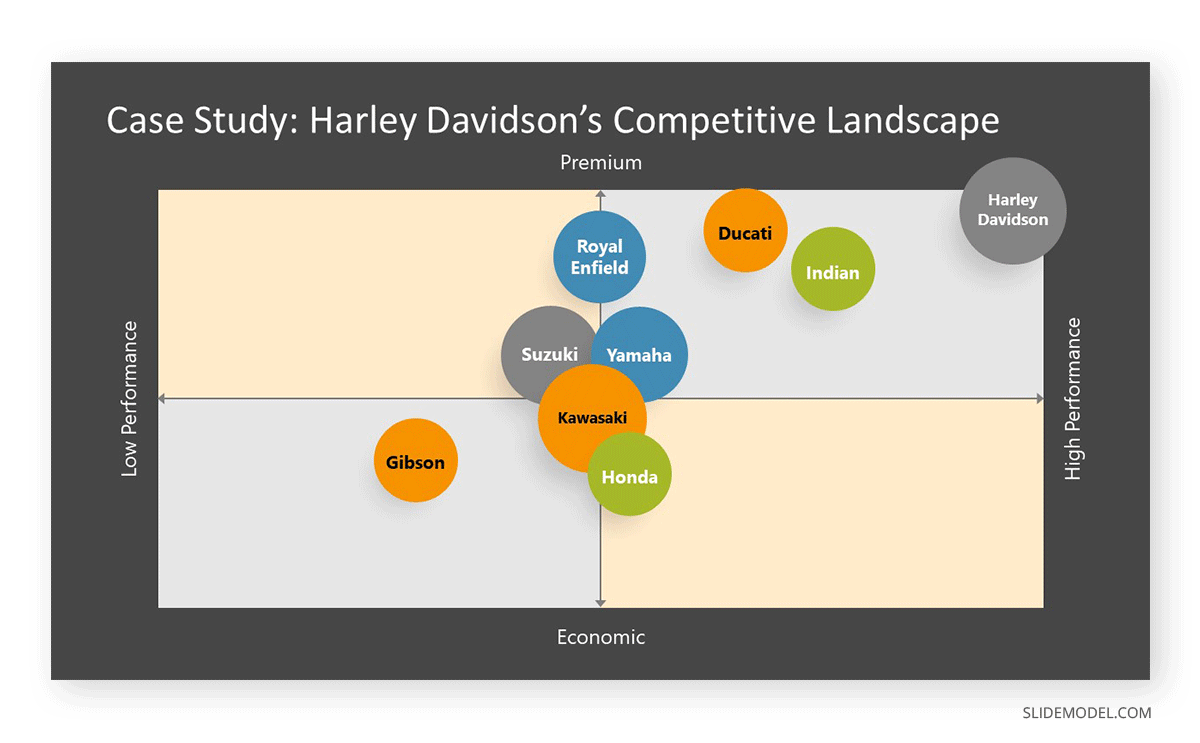
A 2-dimensional perceptual mapping analysis showed that Harley Davidson, a motorcycle manufacturing company, has established itself as a highly premium and reliable brand in its target market. Harley Davidson faces strong competition from Japanese manufacturers such as Honda, Yamaha, Kawasaki, and Indian motorcycles. These competitors have gained a strong foothold by offering value for money and emphasizing reliability.
Surprisingly, despite the availability of more affordable alternatives, Harley Davidson seems to have successfully weathered these challenges. The company has managed to command larger premiums than its rival products, indicating its ability to maintain a favorable position in the market.
In a Harvard Business Review article, Richard A. D’Aveni highlighted the key factors contributing to Harley Davidson’s remarkable success. He emphasized that a significant portion of Harley-Davidson’s achievements can be attributed to the intangible secondary benefits the company provided to its customers, like the image associated with membership in the Harley Owners Group (HOG) and the appeal of Harley-Davidson’s MotorClothes apparel.
Harley Davidson was able to create a distinct impression among its customers. It cultivated an image of rebellion, adventure, and belonging to an exclusive and macho club.
Although the company is in a comfortable market position, it must not rest on its laurels. They can explore new revenue streams like low-CC motorcycles for those looking for entry-level options. There is a gap in this segment, and given Harley Davidson’s proven reputation, it is something they can easily capture.
Recommended Templates for Creating Perceptual Maps
1. Perceptual Map PowerPoint Template
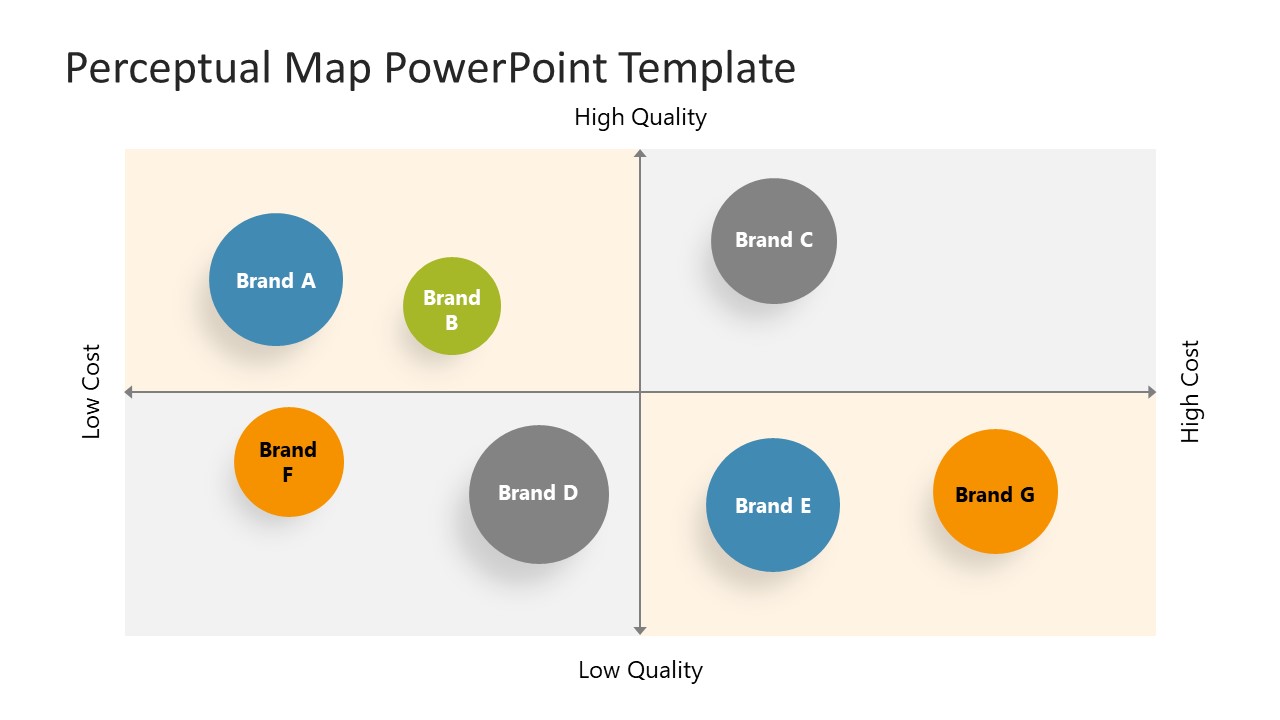
The Perceptual Map template shown in this article, this presentation template can help us craft a perceptual map analysis in just minutes by editing its text, shape positioning, colors, and size. Both shapes and axes texts can be customized to meet the requirements of our presentation. Size helps us establish a secondary category in this analysis, which can be interpreted as the market size for each brand – or even add a legend below to express another particular characterization.
2. Brand Positioning Map PowerPoint Template
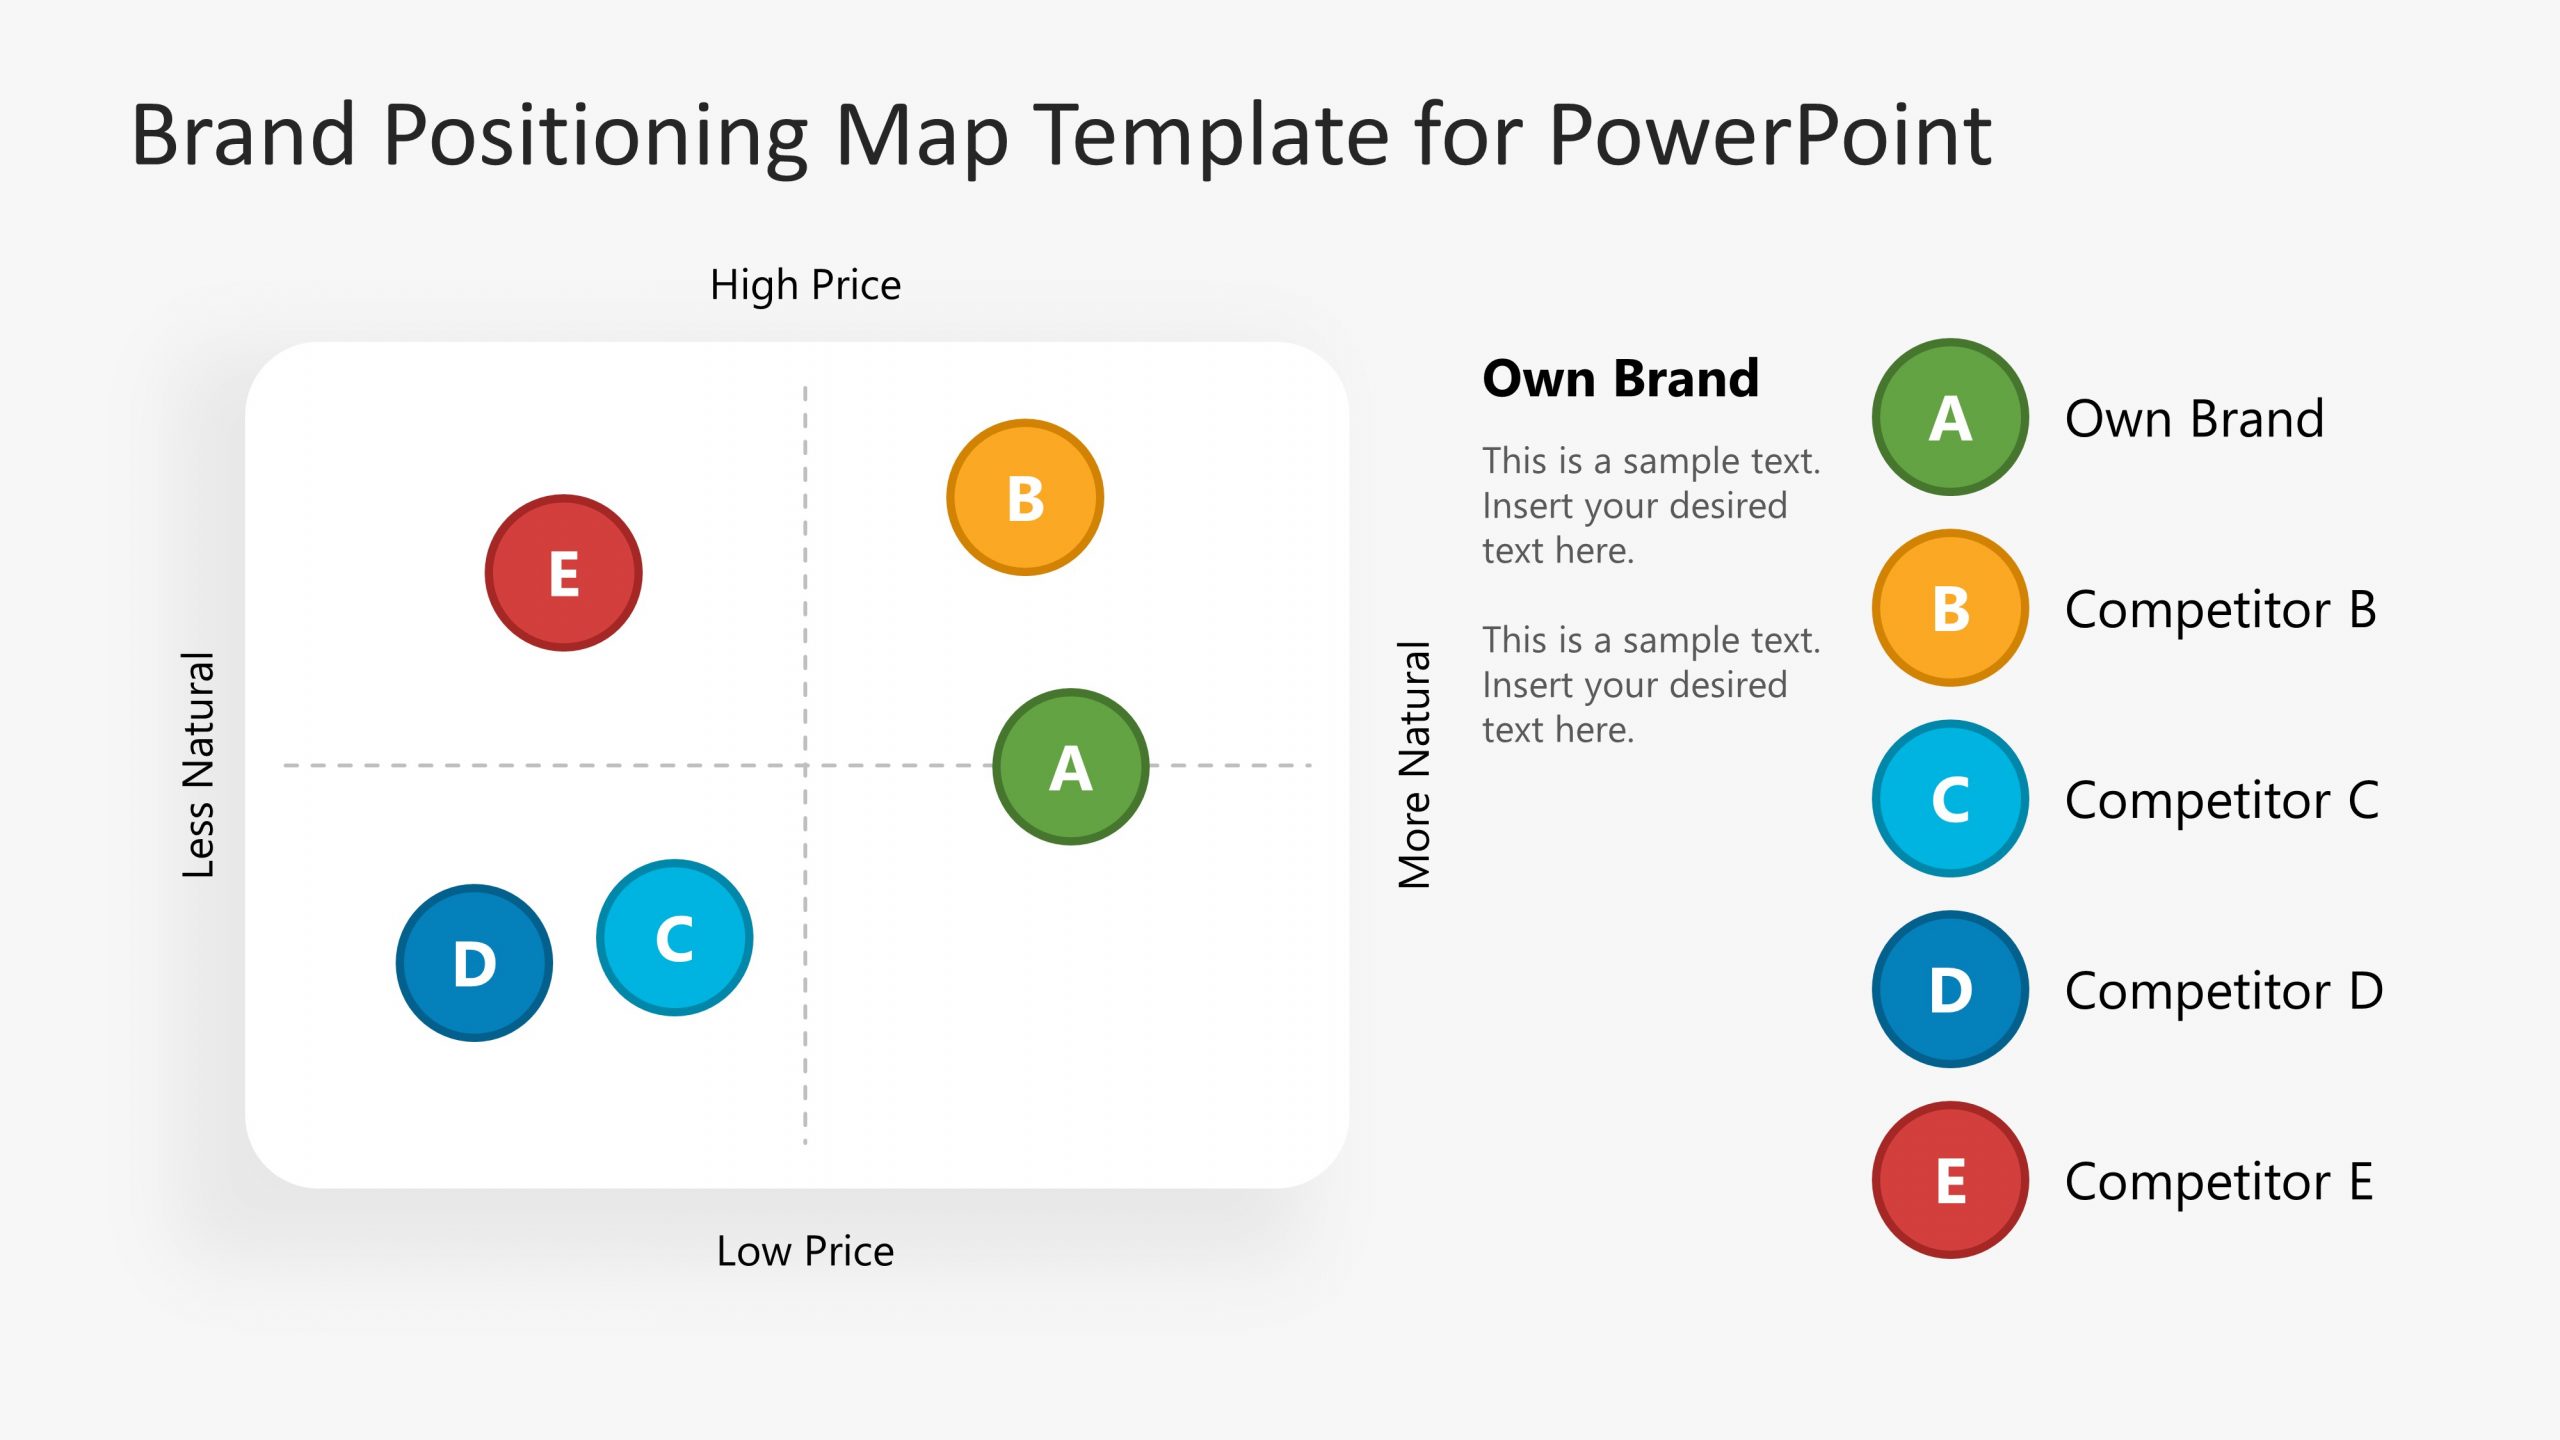
A simplified version of the previous template, this Brand Positioning Map is a perceptual map shown in a series of layouts. We can find it as a conventional perceptual map, a 3×3 matrix, or a compared map slide. Competitors and our brand are displayed as same-sized circular shapes with an identifier letter. The color code and legend are shown on the right side of the slide and can be completely customized for the requirements of our presentation.
This simplistic layout helps to focus on the main factors linked to brand positioning, and given its easy-to-approach format, we can edit it in just a couple of minutes.
3. Modern Competitive Analysis PowerPoint Template
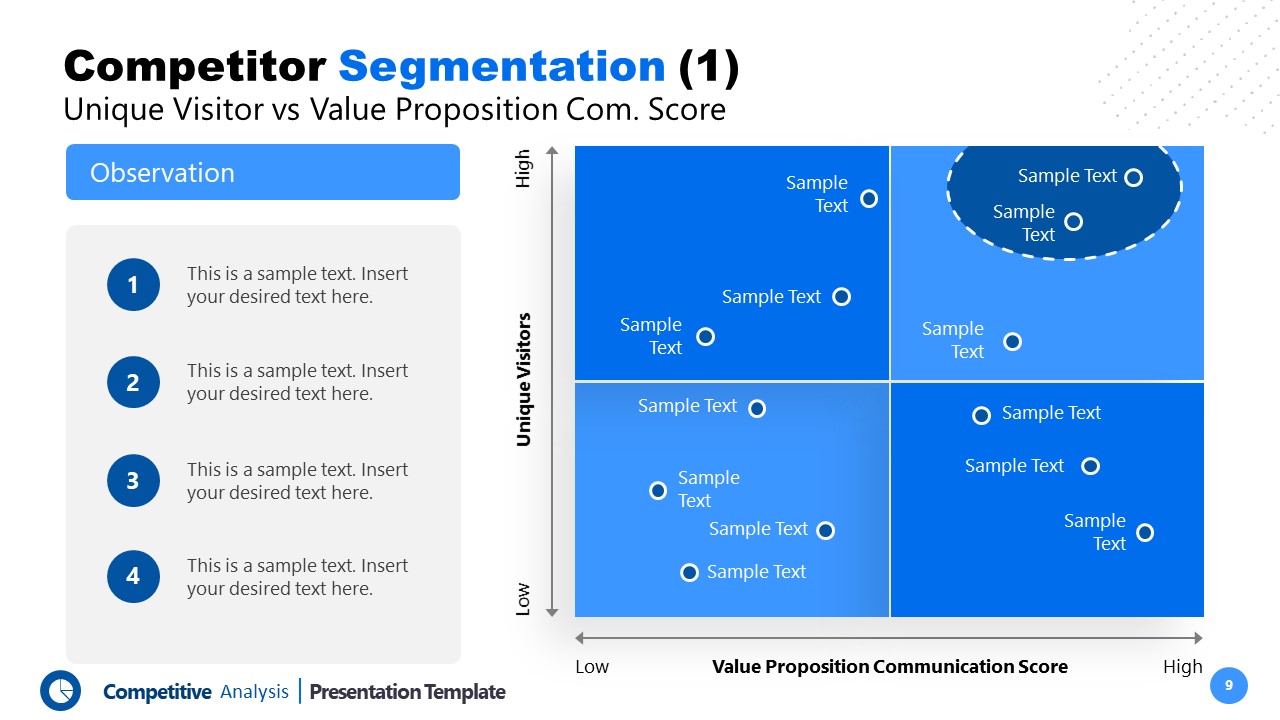
Get your hands on a slide deck that not only features the perceptual map but also lists a series of tools intended to run a professional-level competitor analysis for any market segment.
The Perceptual Map used in this slide deck has two distinctive slides, the first one being a traditional two-axis perceptual map with tiny dots and placeholder texts next to them, in which we can highlight an area by dragging the dashed line shape in a darker color background. The second slide relevant for this purpose is an evaluation of Unique Visitor vs. Price, which helps us evaluate how newcomers to our website react to the pricing range and where we stand in comparison with other actors in the industry.
Conclusion
With its ability to uncover your customers’ notions about your brand and competitors, perceptual mapping lays the foundation for successful brand positioning and market penetration. Implementing a well-crafted perceptual map is essential for businesses aiming to achieve sustainable growth and build a strong market presence.
While making your perceptual map, you can assume that your competitors are making theirs too. This means the market landscape is dynamic and subject to change over time. To stay competitive, it is essential to regularly update and refine your perceptual map based on the evolving market dynamics.