Display the gathered data about your competitors’ marketing and sales strategies comprehensively using the Competitive Analysis Diagram PowerPoint Template. Competitive analysis is identifying potential competitors in your industry and analyzing their business strategies to make business decisions accordingly. It is important for an organization that aims to stand out in a crowded or competitive market. Competitor analysis involves studying the market gaps to provide a unique value proposition to your costumes. Once you understand the industry landscape, you can make informed decisions and acquire a competitive advantage in the market. This competitive analysis diagram template is crafted for marketers and sales executives. They can demonstrate the results of their market research in the executive sessions.
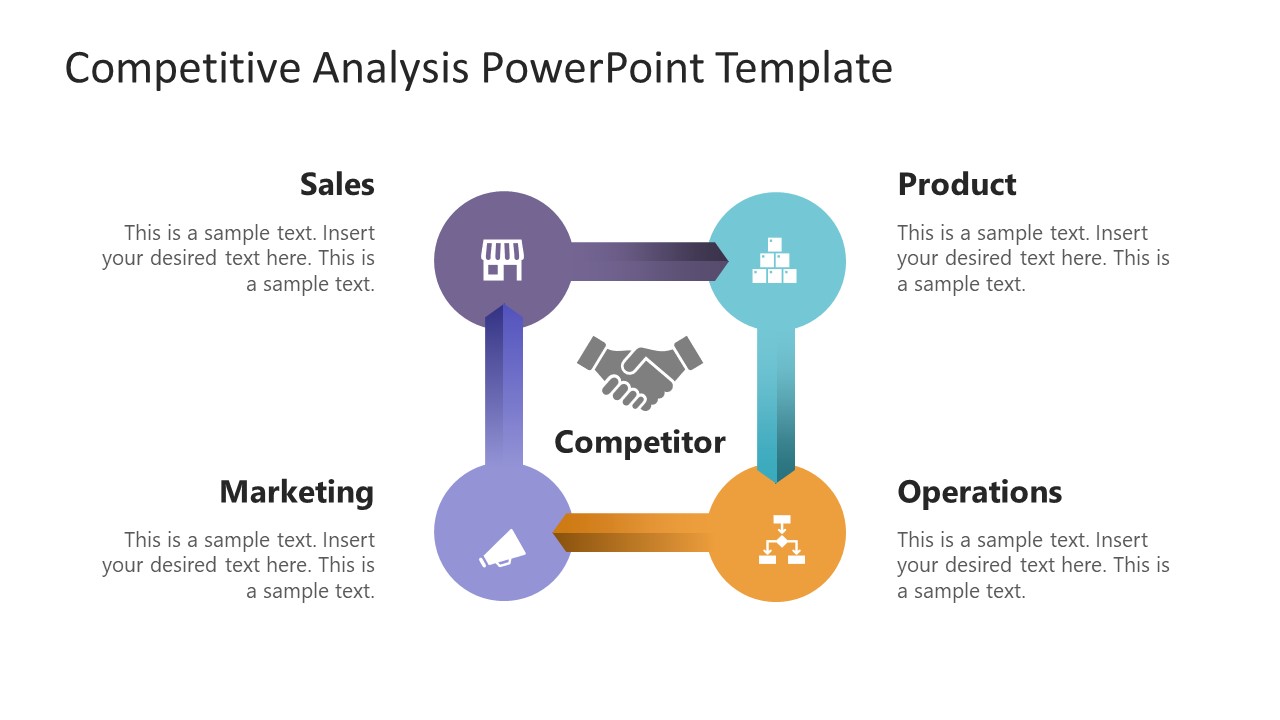
This Competitive Analysis Diagram PowerPoint Template consists of four PowerPoint slides, each with a creative diagram. The first slide contains a circular shape divided into four quadrants. These quadrants display the following four attributes of competitive analysis:
- Sales: Here, you can present the sales strategies of your competitor,
- Products: In this part, users can display the details of the key products available in the market.
- Marketing: In this heading, the professionals can mention the marketing strategies your competitor is employing to reach out to the customers.
- Operations: This section highlights the operational tactics used in your industry.
In all four slides, relevant infographic icons visually depict the content. This creates an engaging impact for the audience and attracts their attention. The second slide has a central square box with a shaking hands graphical icon. From the center, four lines originate and connect with the four tiers of competitive analysis. Furthermore, we have provided editable textboxes for presenters to mention the relevant details. In the second and third slides, the same aspects of market research are displayed with slight variations in the central diagram. Before a product launch or to achieve a new business objective, use our competitive analysis PPT template to discuss these critical details in the business meetups. So, download this 100% editable presentation template now!
What’s inside this template
Example presentation scenarios
- A marketing manager can use the four-quadrant circular diagram to brief executives on how a competitor positions its product, promotes offers, sells to customers, and operates in the market.
- A sales leader can use the hub-and-spoke competitor map to organize account team observations around sales tactics, product strengths, marketing activity, and operational moves before a competitive pursuit.
- A product manager can use the connected loop diagram to explain how competitor product decisions relate to marketing messages, sales approach, and operations before a launch review.
- A consultant can use the four-petal matrix to summarize interview or research findings for a client team and keep attention on the four repeated analysis categories.
Features
- 100% editable presentation template
- Compatible with Microsoft PowerPoint
- 16:9 aspect ratio slides
- Scalable vector shapes, icons and illustrations
- AI-Ready for Microsoft Copilot and Claude
- Instant access and download
Frequently asked questions
Q: How should a presenter organize the message with these competitive analysis diagrams?
A: Start by defining the competitor or market segment in the center, then keep each category focused on one type of evidence. Use sales for go-to-market behavior, product for offer comparisons, marketing for customer reach, and operations for delivery or process signals. This keeps the slide from becoming a general notes page.
Q: Who is this template best suited for in a business review?
A: This template fits marketing, sales, product, and strategy presenters who need to brief decision-makers quickly on competitor behavior. It works best when the goal is to summarize findings across four business lenses rather than show deep financial analysis. The repeated category structure helps teams compare research consistently.
Q: Why do the circle, hub, loop, and petal diagrams work for competitor analysis?
A: Each layout places the competitor at the center and arranges the four categories around it, which reinforces the idea that sales, product, marketing, and operations are connected. The hub and loop versions suggest relationships among categories, while the quadrant and petal layouts make the comparison easy to scan.




Competitive Analysis Diagram PowerPoint Template
4-slide 16:9 presentation template for competitive analysis diagrams, sales, product, marketing, and operations
Competitive Analysis Diagram PowerPoint Template is a 4-slide Microsoft PowerPoint deck for summarizing competitor research. It includes a four-quadrant circular diagram, a hub-and-spoke competitor map, a connected category loop, and a four-petal matrix covering sales, product, marketing, and operations.
- Category
- Diagrams
- Rating

 Loading...
- Aspect ratio
- 16:9
- Item ID
- 22247-01
- Colors
 Microsoft PowerPoint
 Microsoft Copilot
 Claude for PowerPoint
Other formats supported
Subscribe today and get immediate
access to download our PowerPoint templates.