How to Add Subscript and Superscript in PowerPoint
Using subscript and superscript in PowerPoint shouldn’t be a challenge. Learn how to properly use these two special type symbols with this guide.
How to Change Line Spacing in PowerPoint
Adjust text formatting by learning how to change line spacing in PowerPoint. Instructions for paragraph indenting included.
How to Group Shapes in PowerPoint
Organize your slides’ content efficiently by mastering how to group in PowerPoint. 3 different approaches to grouping and ungrouping elements.
How to Create an Action Button in PowerPoint
Create engaging presentation slides by learning how to make an action button in PowerPoint. Add CTAs to your slides in just minutes.
How to Add Bullet Points in PowerPoint
Become a master of summarizing presentation’s key points by learning how to add bullet points in PowerPoint

How To Present a 5 Why’s Root Cause Analysis
The regular rut of life or the professional wheel, problems can leave you fumbled and dumbstruck at any bend of the road. Mostly unforeseen and uninvited, some problems can have you at your knees while others can bring you to the wits end in an instant. Irrespective of which realm of life you encounter a […]
How to Outline Text in PowerPoint
Add creative effects to your slides by learning how to outline text in PowerPoint. An ideal solution to make texts stand out.
How to Select All Slides in PowerPoint
Speed up your slide design workflow by knowing how to select all slides in PowerPoint. Master the shortcuts and tips for this process.
How to Mirror an Image in PowerPoint
Quickly customize your presentation slides by mirroring images in PowerPoint. Step-by-step process for single and multiple images.
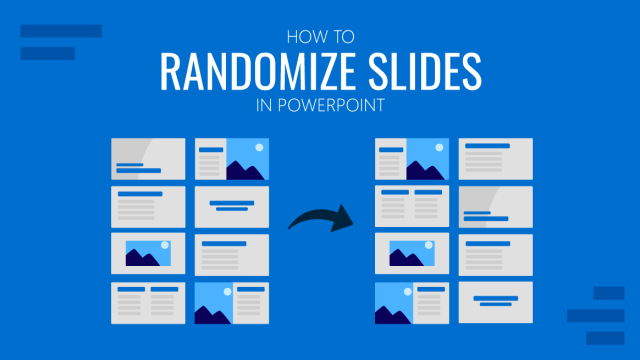
How to Randomize Slides in PowerPoint
Join us today and learn how to code your first Macro to randomize slides in PowerPoint. Options for a fixed or uncertain number of slides.
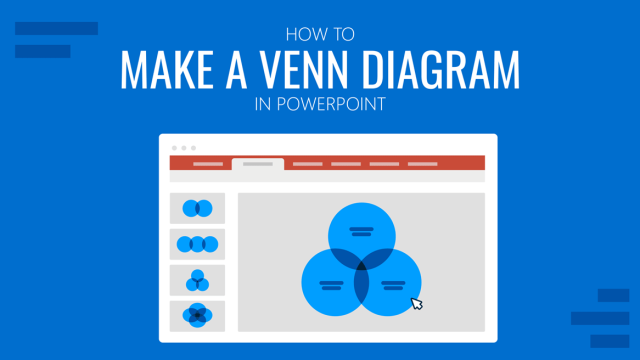
How to Make a Venn Diagram in PowerPoint
Discover how easy is to make a Venn Diagram in PowerPoint with three different methods: SmartArt, PowerPoint shapes, and Venn Diagram PowerPoint Templates.
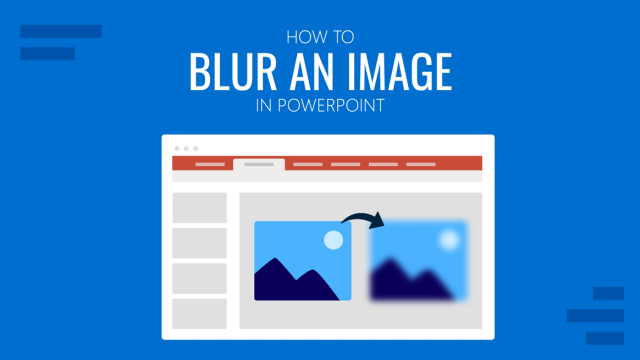
How to Blur an Image in PowerPoint
Customize your presentation slides with creative effects. Learn how to Blur an Image in PowerPoint with this article.