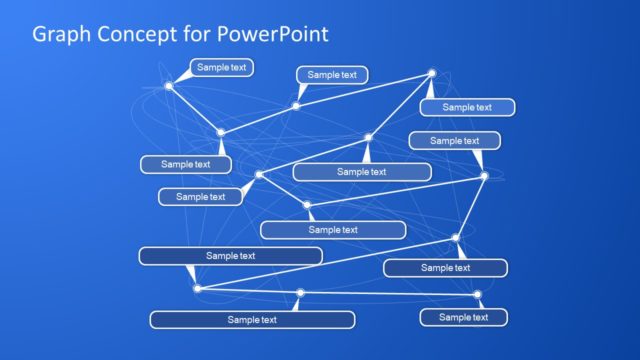
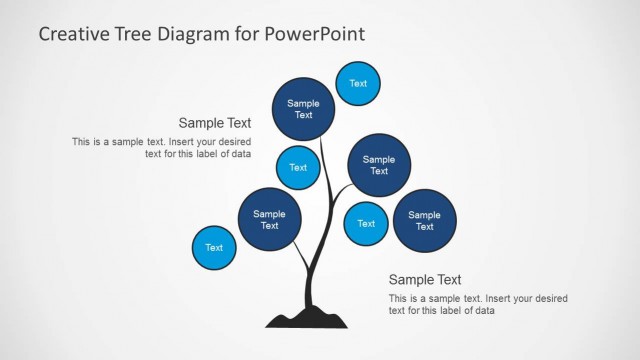
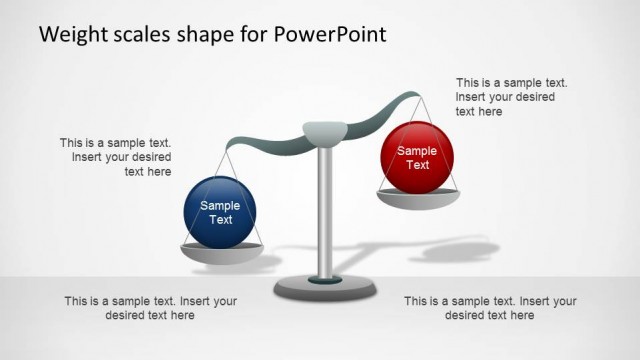
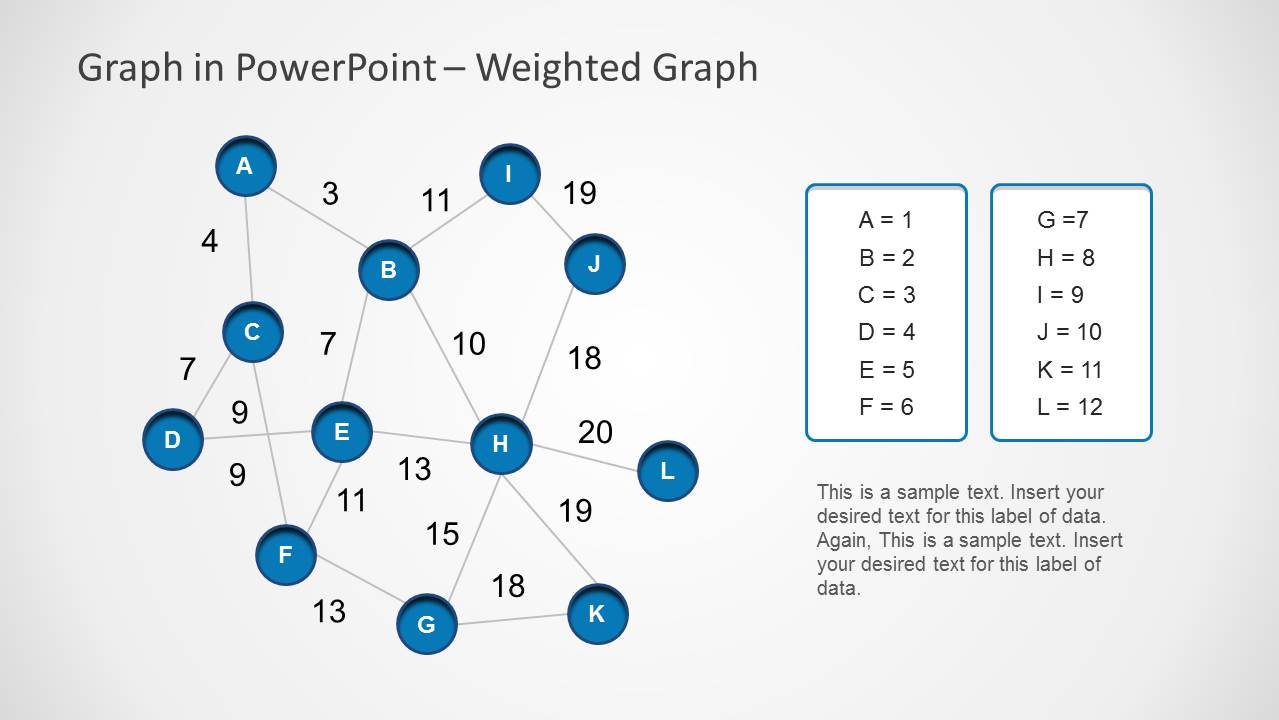
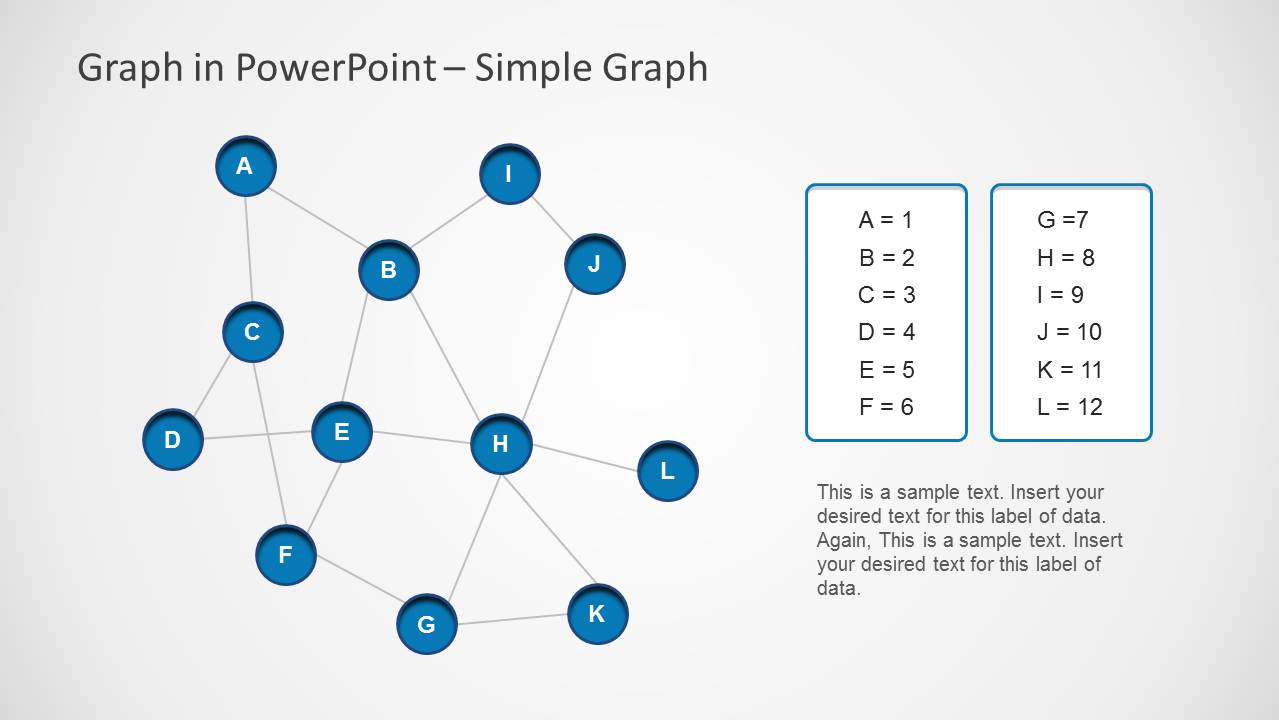
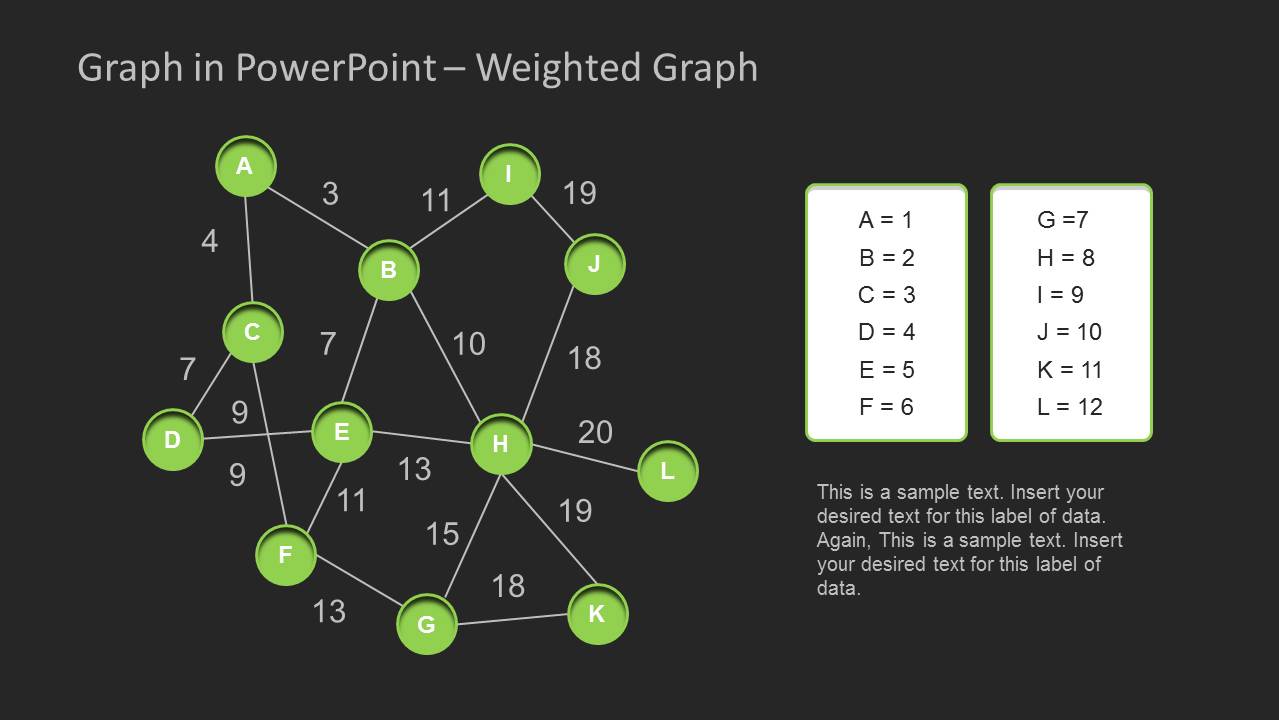
Weighted Graph design for PowerPoint is a presentation template containing four slide designs with simple and weighted graph illustrations. You can use this Math graph template to make presentations on Critical Path analysis but also model complex stochastic processes in PowerPoint or model complex node graph architectures with vertex and graphs.
What’s inside this template
Example presentation scenarios
- A math instructor can use the weighted graph layout to teach how edge values affect path selection between labeled vertices.
- An operations analyst can present a critical path discussion by placing cost, time, or probability values on the weighted graph edges.
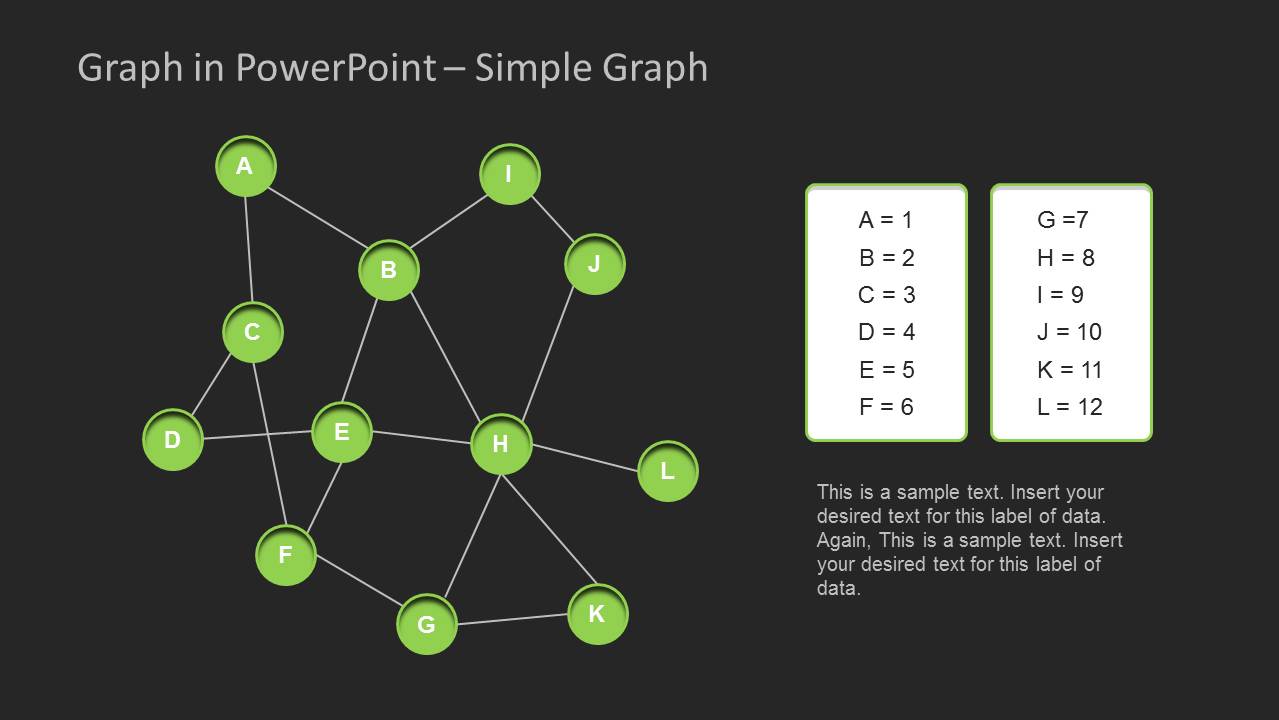
- A computer science presenter can use the simple graph layout to introduce vertex adjacency before moving into weighted edges.
- A technical consultant can use the side legend boxes to map node letters to systems, tasks, locations, or process stages.
Features
- 100% editable presentation template
- Compatible with Microsoft PowerPoint and Google Slides
- 16:9 aspect ratio slides
- Scalable vector shapes, icons and illustrations
- AI-Ready for Microsoft Copilot and Claude
- Instant access and download
Frequently asked questions
Q: How should a presenter explain the weighted graph without overwhelming the audience?
A: Start with the node labels and the legend boxes before discussing the edge numbers. On the weighted slides, explain one path at a time and use the text area to state what the numbers represent, such as cost, distance, time, or probability. This keeps attention on the relationship logic instead of the full network at once.
Q: Who is this template best suited for in a business or academic presentation?
A: It is best for presenters who need to explain connected decisions, routes, dependencies, or system relationships. Analysts can frame critical path tradeoffs, instructors can teach graph theory, and technical teams can map simplified network architecture. The simple graph slides work well for introduction, while the weighted slides support deeper analysis.
Q: Why include both simple graph and weighted graph versions?
A: The pair supports a step-by-step explanation. The simple graph shows structure first, so the audience understands which vertices connect. The weighted graph then adds meaning to each edge, turning the same network into a decision model. This sequencing helps separate topology from evaluation criteria.

Weighted Graph Template for PowerPoint
4-slide presentation template with weighted graph and simple node network diagrams for decision analysis.
Weighted Graph Template for PowerPoint is a 4-slide diagram template for presenting node networks, weighted graph paths, simple graph connections, and vertex legends. It is built for educators, analysts, and technical presenters explaining graph theory, critical paths, probability models, or network structures in Microsoft PowerPoint and Google Slides.
- Category
- Diagrams
- Rating


 Loading...
- Aspect ratio
- 16:9
- Item ID
- 6176-01
- Colors
 Microsoft PowerPoint
  Microsoft Copilot
  Claude for PowerPoint
 Other formats supported
Subscribe today and get immediate
access to download our PowerPoint templates.