4 Circle Venn Diagram PowerPoint Templates
Download from our 4 Circle Venn Diagram designs collection for your analytical projects and presentations. These Venn Diagram 4 Circles PowerPoint slides and layouts are designed with relevant icons and colors to showcase your complex data.
By incorporating our Venn Diagram With Four Circles, you can increase the impact of your presentations and communicate ideas with ease with your audience. These Venn Diagram templates are compatible with PowerPoint, Office 365, Google Slide, and Keynotes on both Mac and Windows computers.
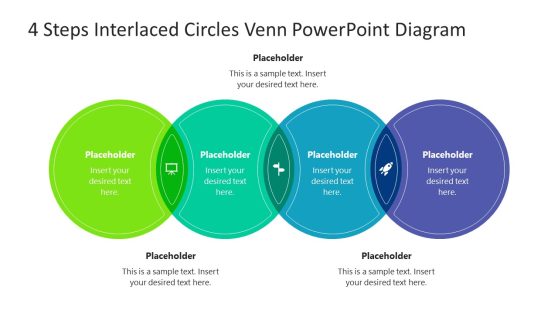
4 Steps Interlaced Circles Venn PowerPoint Diagram
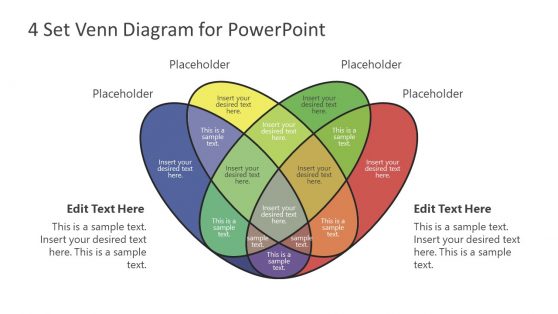
A 4 Circle Venn Diagram is commonly used in analytical projects and presentations to showcase complex data. Typically, these models are used in mathematics and any discipline with a huge input of data analysis. Still, they can serve to express complex relationships, study behavioral patterns, and way more.
Whether you are a business professional presenting sales figures, a researcher demonstrating data correlations, or a teacher explaining complex concepts, our 4 Circle Venn Diagram templates can help you effectively convey your message. These four-way Venn diagram template come in various colors, styles, fonts, and font sizes, each with unique graphic elements carefully selected to serve their intended purpose. You can change the templates to your preferred color and edit the placeholders with your desired content.
What is a 4 Circle Venn Diagram?
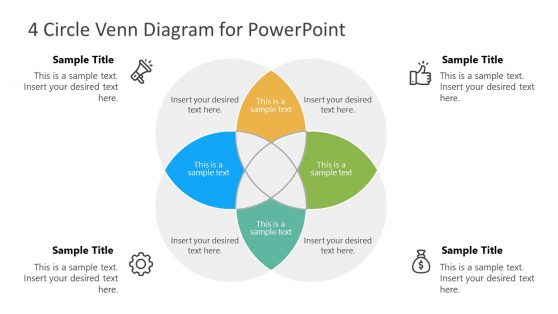
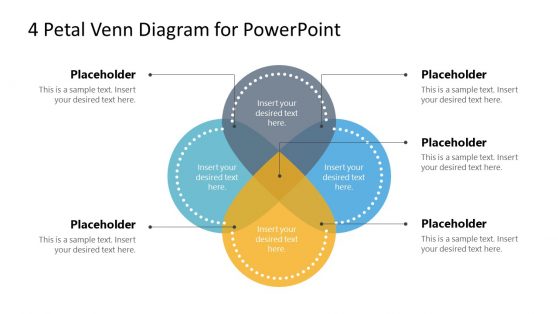
A 4 Circle Venn Diagram is a graphical representation of the relationships between four data sets. It consists of four overlapping circles, each representing a set, and the areas where the circles overlap represent the relationships between the sets.
Can a Venn Diagram have 4 circles?
Yes, Venn diagrams can have four circles as long as the represented sets have some degree of overlap. The more sets included, the more complex the diagram becomes, but the basic principles of a Venn diagram remain the same.
How do you make A 4 Circle Venn Diagram In PowerPoint?
To create a 4-Circle Venn Diagram in PowerPoint, use the built-in SmartArt tool or download a pre-designed template. Here are the steps to create a 4 Circle Venn Diagram using SmartArt:
- Open a new PowerPoint presentation and navigate to the slide where you want to add the diagram.
- Click on the “Insert” tab in the ribbon menu and select “SmartArt” from the “Illustrations” section.
- In the “Choose a SmartArt Graphic” dialog box, select the “Relationship” category and choose the “Basic Venn” option.
- In the “Text” pane on the left-hand side, enter the labels for each of the four circles and adjust the layout and style of the diagram as needed.
Alternatively, download the pre-designed 4 Circle Venn Diagram templates by SlideModel. Once you download the template, you can customize it by editing the text and colors to fit your specific needs. Also, check our tutorial on how to make a Venn Diagram in Google Slides.
What are Venn Diagrams used for?
Venn diagrams are used to illustrate relationships between different sets of data. They are often used in mathematics, statistics, and data analysis but can also be used in other fields, such as business, education, and science, to represent complex data visually.
Are there any limitations to using Venn Diagrams?
Yes, Venn Diagram has a limitation: it can only represent a finite number of sets. Additionally, as the number of sets and their relationships become more complex, it can be difficult to accurately represent them using Venn diagrams. Finally, Venn diagrams are a static representation of data, meaning they cannot be easily updated or changed once created.