5 Circle Venn Diagram Templates for PowerPoint
Our 5 Circle Venn Diagram PowerPoint template allows you to compare and analyze up to five sets of data effectively. You can use these templates for various purposes, such as business presentations, academic reports, and more. Whether you’re a student, a business professional, or a researcher, our 5 Circle Venn Diagram PowerPoint template can help you communicate your data to your audiences visually without hassle.
Download our 5 Circle Venn Diagram PowerPoint template now and save yourself the hassle of designing a Venn diagram from scratch.
Featured Templates
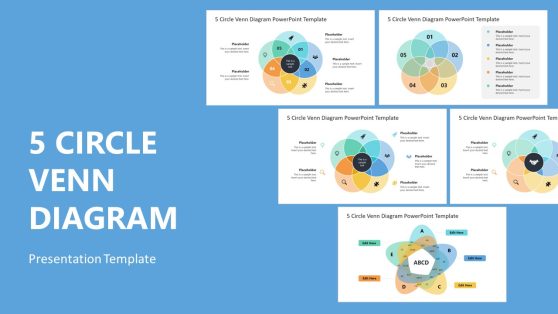
5 Circle Venn Diagram PowerPoint Template
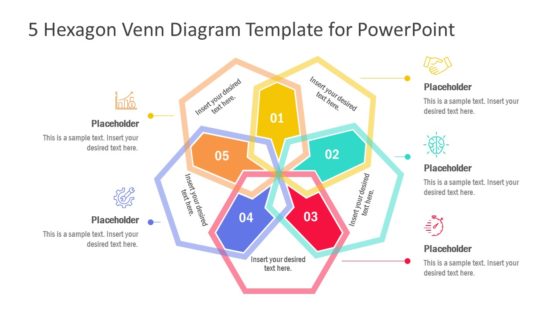
5 Hexagon Venn Diagram PowerPoint Template
5 Steps Chevron Pentagon PowerPoint Diagram
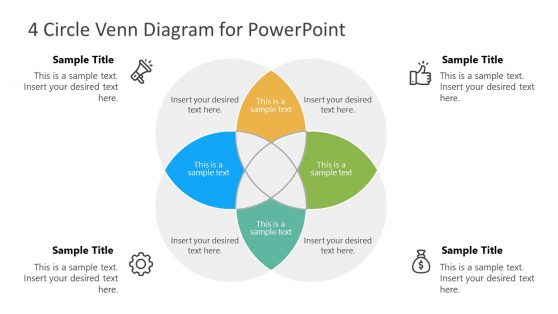
4 Circle Venn Diagram for PowerPoint
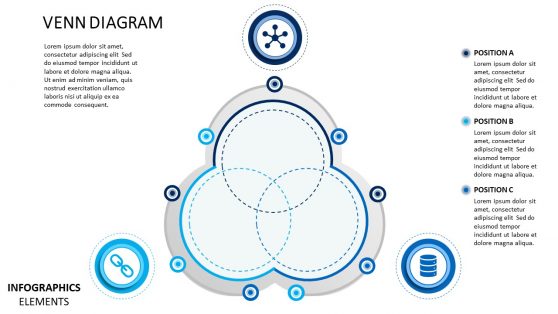
Venn Diagram Material Design for PowerPoint
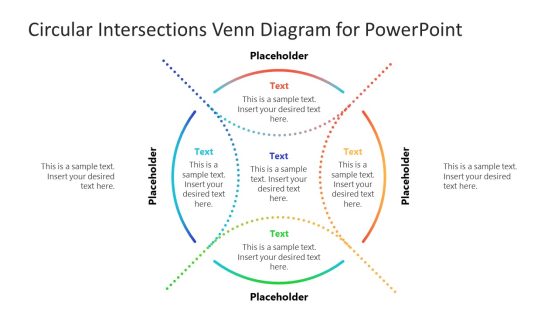
Circular Intersections Venn Diagram for PowerPoint
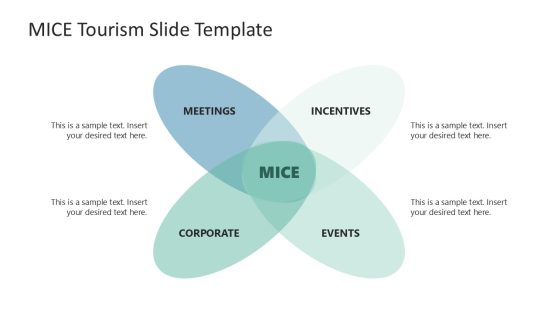
MICE Tourism Slide Template for PowerPoint
Latest Templates
Our 5 Circle Venn Diagram PowerPoint template is designed to help you visualize and compare complex data. It allows you to identify patterns and trends in your data and communicate your findings to your audience.
You can also customize any of these templates to suit your preferences. Our Venn Diagram 5 Circles has various slides and elements, including labels, icons, and text boxes.
Whether you are presenting customer demographics, product categories, or geographic regions, our template allows you to compare and analyze data easily by simplifying complex information into an easy-to-understand format. You can use it to enhance the impact of your presentations and improve communication with your audience. And also, our 5 Circle Venn Diagram PowerPoint templates are compatible with PowerPoint, Office 365, Google Slide, and Keynotes on Mac and Windows computers.
What is a 5 Circle Venn Diagram?
A 5 Circle Venn Diagram is a visual illustration of five sets of data, where each circle represents a set, and the overlapping regions represent the intersection of those sets. Five circles overlap in a 5-Circle Venn Diagram to create 31 possible intersection regions. You can use these diagrams to compare and analyze data across multiple dimensions.
Can a Venn Diagram have 5 circles?
Yes, a Venn Diagram can have any number of circles, including 5. However, as the number of circles increases, the complexity of the diagram also increases.
How do you make a 5 Circle Venn Diagram in PowerPoint?
To create a 5 Circle Venn Diagram in PowerPoint from scratch. Here are some steps to create a 5 Circle Venn Diagram from scratch:
- Open PowerPoint and insert a SmartArt graphic.
- In the SmartArt graphic menu, select the “Cycle” option.
- Choose the “Basic Venn” diagram style.
- Edit the diagram to have 5 circles by adding and adjusting the size of the circles.
- Customize the colors and styles of the diagram as desired.
- Add text labels to each circle and overlapping region to represent the sets and intersections.
- Save the diagram and use it in your presentation.
Alternatively, you can use our collection of 5 Circle Venn Diagram templates collection and download the one that suits your needs. Then, customize it with your data and text to create a professional-looking diagram.
Can Venn diagrams be used for decision-making?
Yes, you can use Venn diagrams for decision-making by helping you visualize and compare different options based on multiple criteria. For example, you can use the Venn diagram to compare the features and prices of different products to help make a purchasing decision. Also, you can use it to map out the pros and cons of different courses of action to help make a strategic decision. Using a Venn diagram to represent the options and criteria helps you weigh the different factors and make a more informed decision.