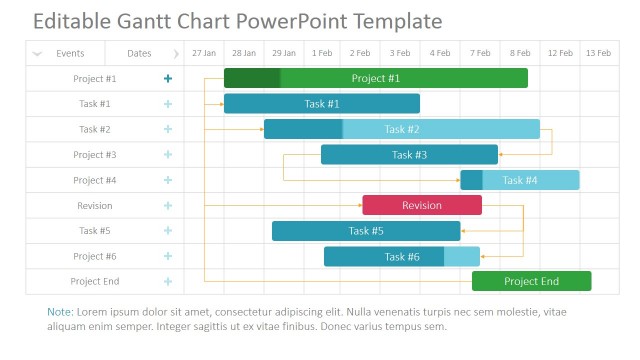
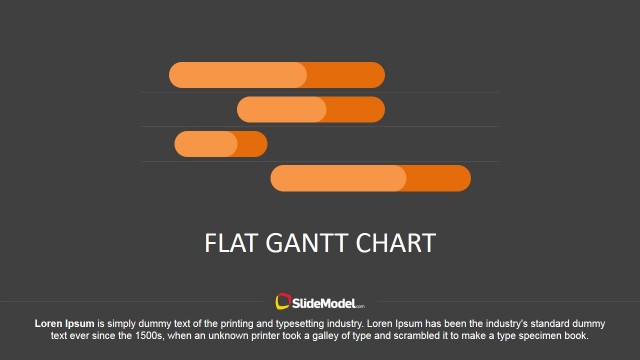
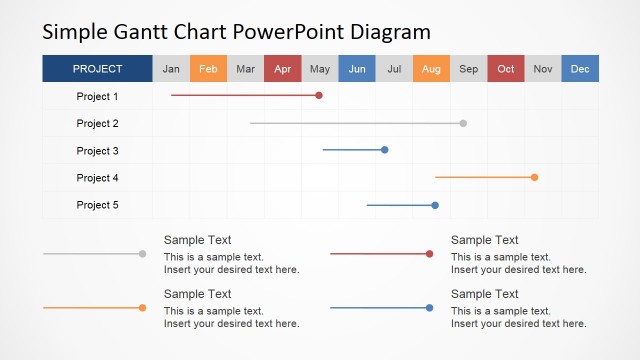
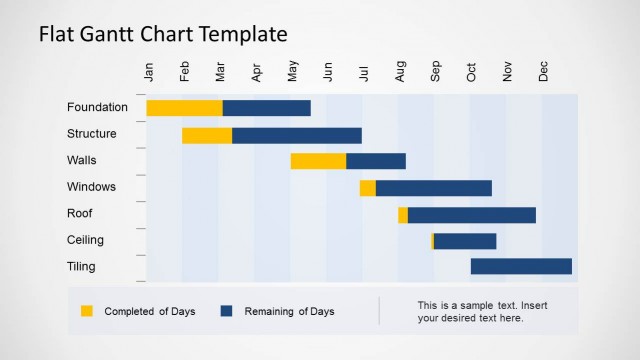
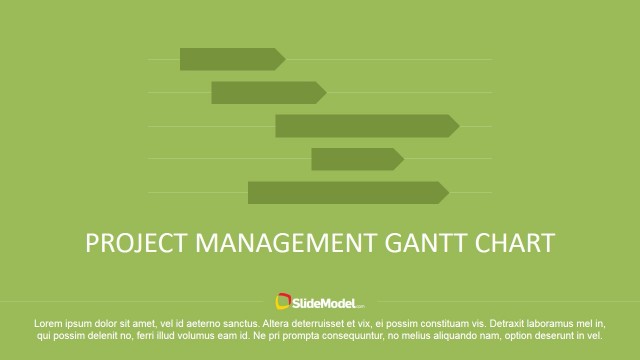
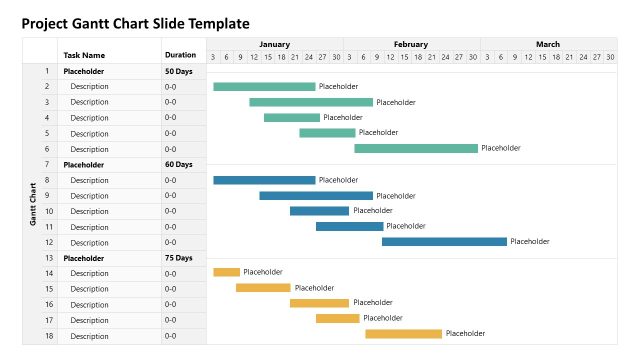
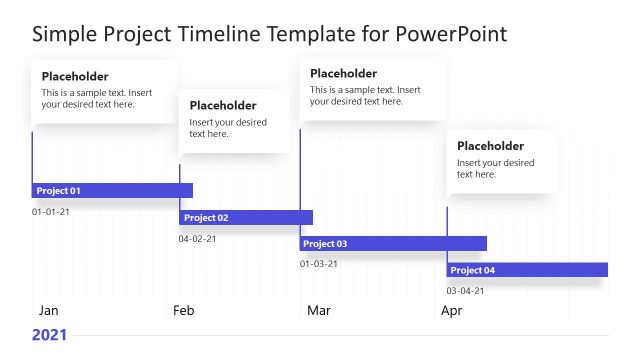
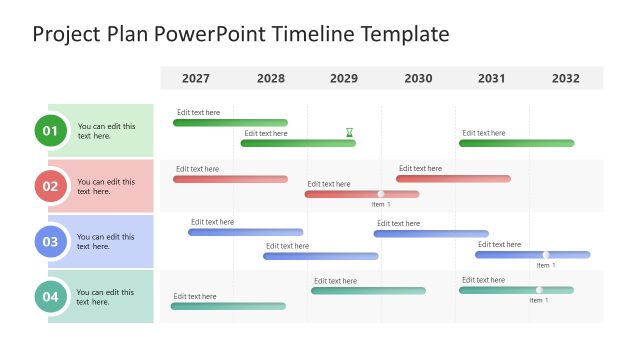
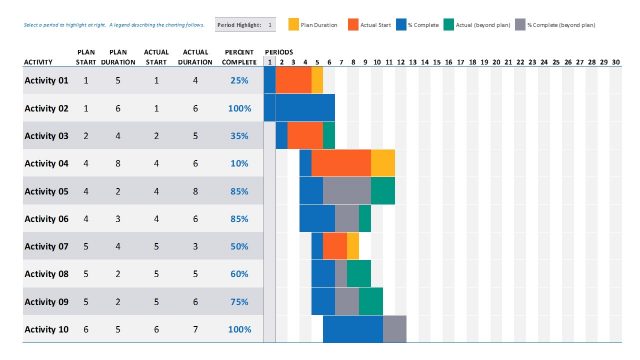
Gantt Chart PowerPoint Template is a simple presentation template for PowerPoint that you can use to create slides with attractive Gantt Charts.
Inside this presentation template you can find pre-designed gantt chart illustrations with modern flat style that can help you to make presentations on project planning and time management PowerPoint presentations.
What’s inside this template
Example presentation scenarios
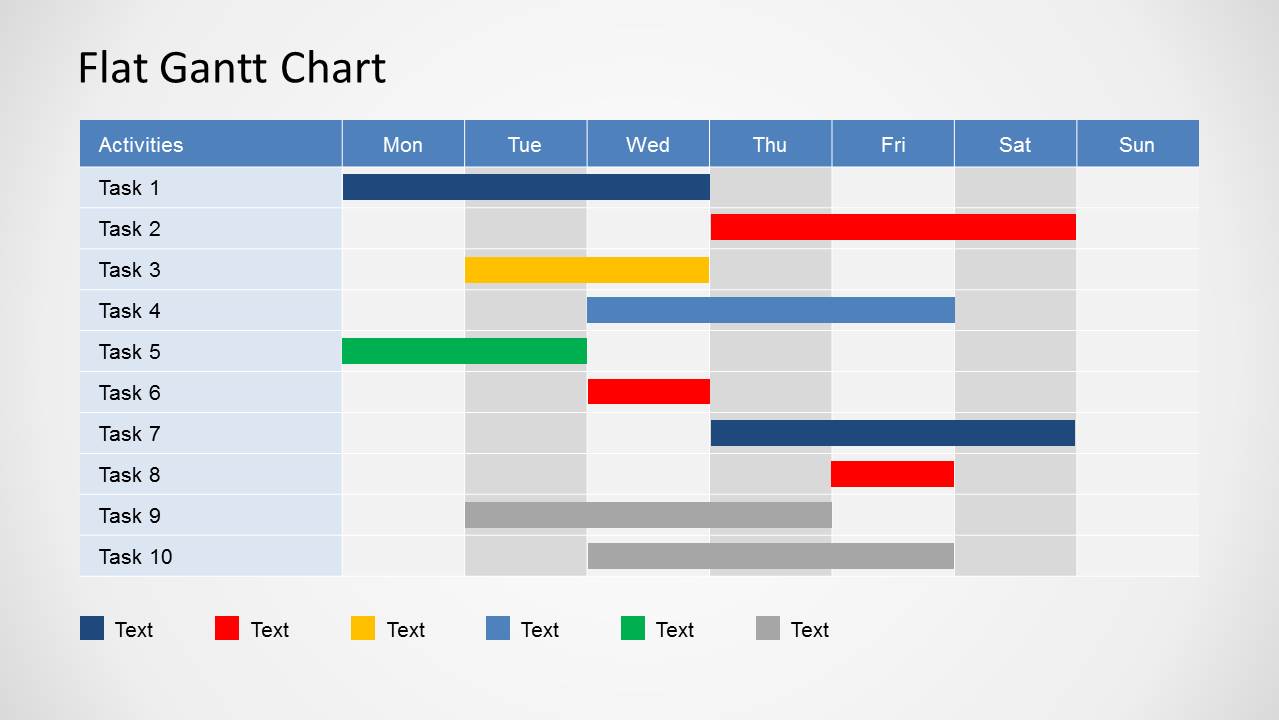
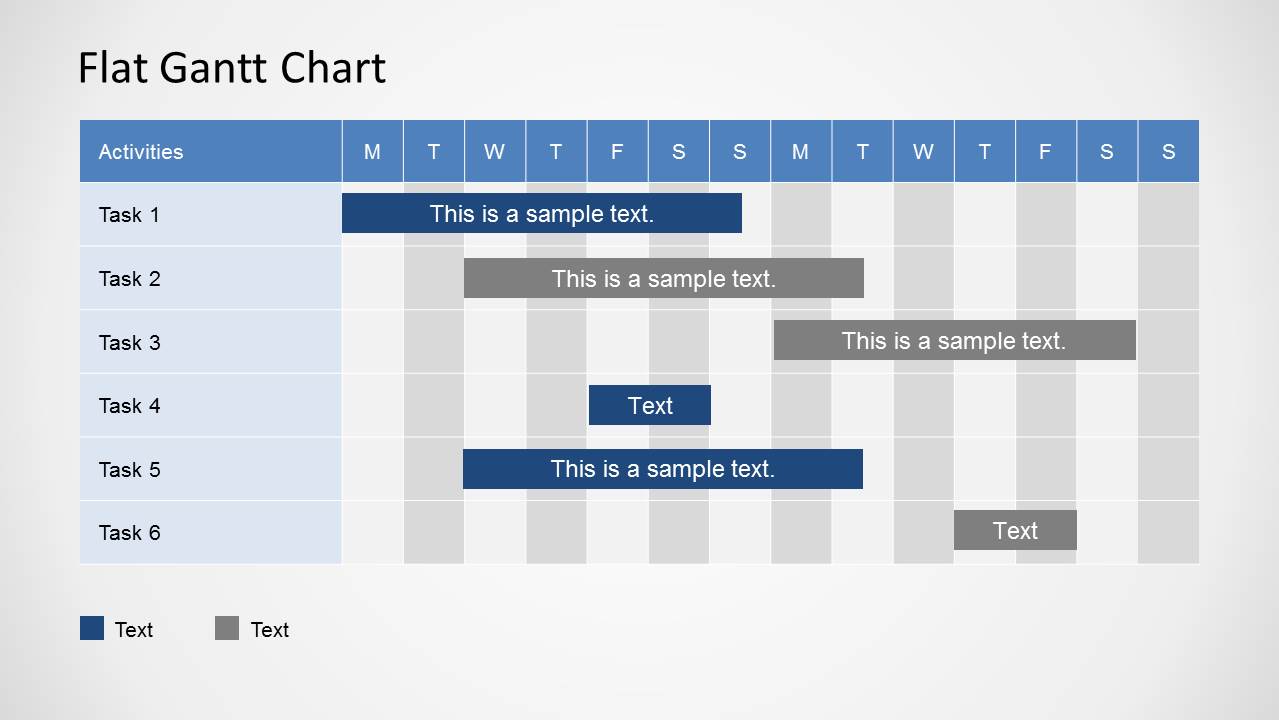
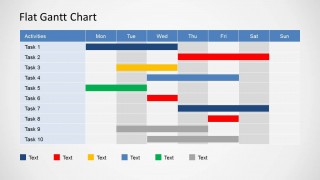
- A project manager can use the weekly Gantt chart to brief a delivery team on task ownership, expected duration, and work happening across each weekday.
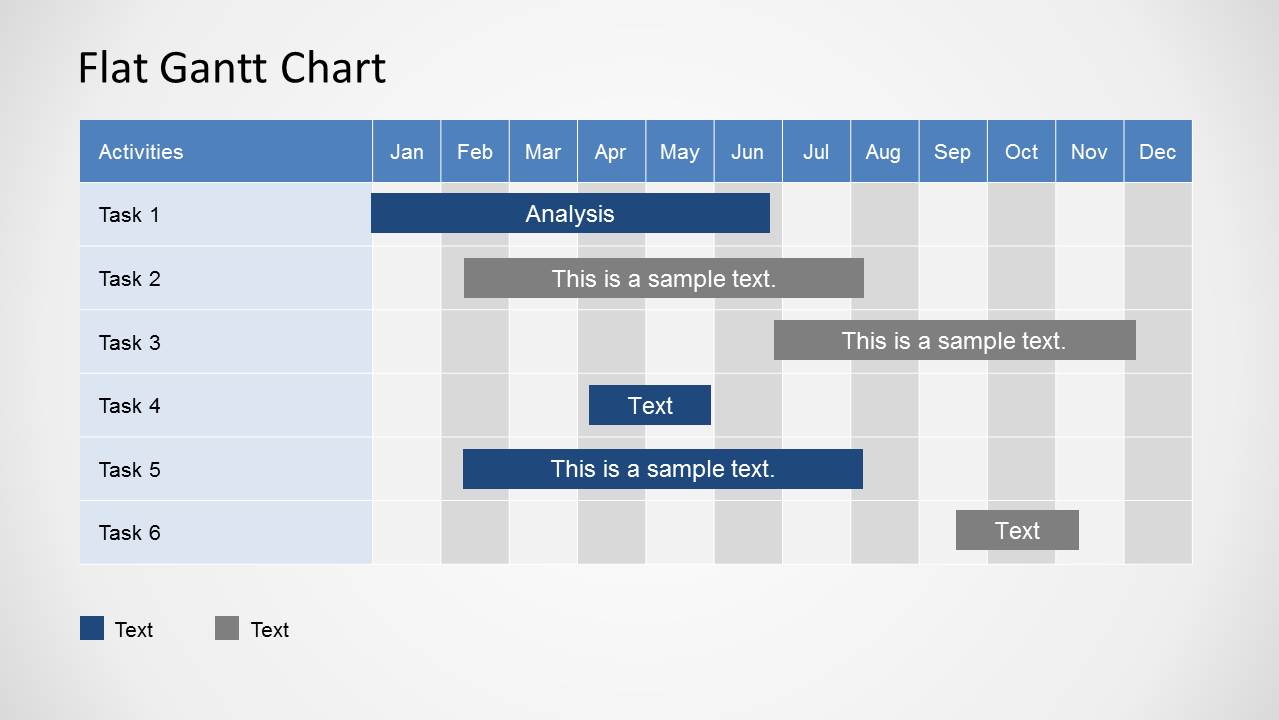
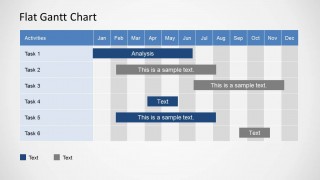
- A consultant can use the monthly roadmap to present a client implementation plan, showing phases such as analysis, execution, and follow-up across the calendar year.
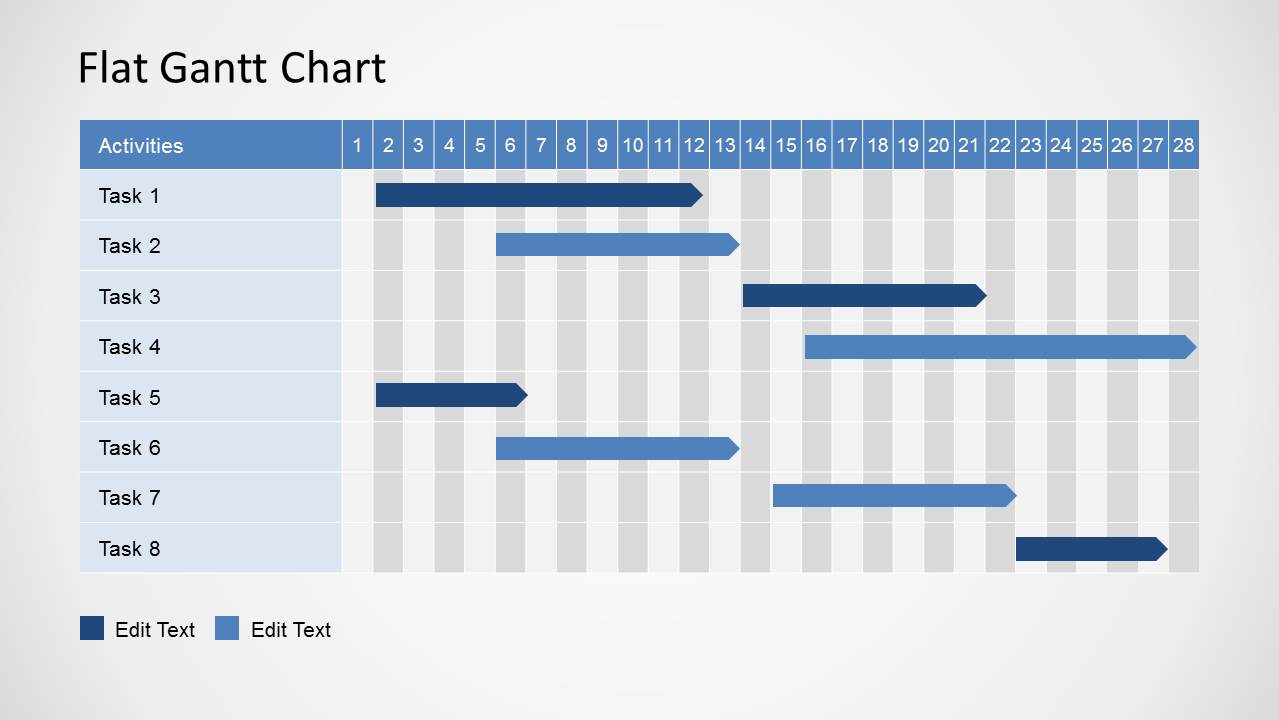
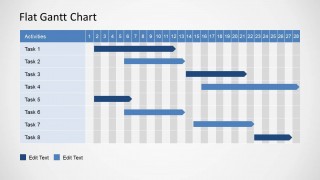
- An operations lead can use the 28-day schedule to coordinate short-cycle activities, show dependencies between tasks, and align the team around near-term deadlines.
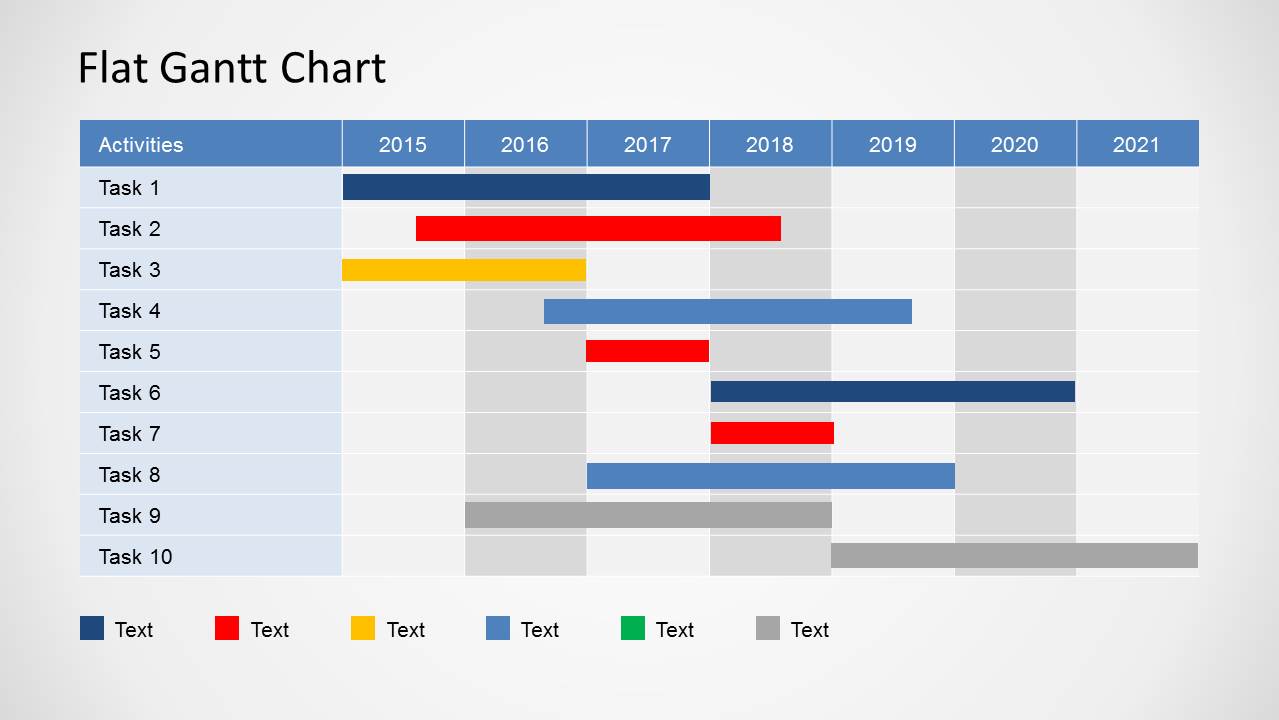
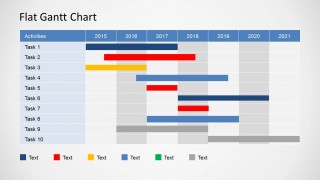
- A program manager can use the multi-year Gantt chart to summarize long-range initiatives for executives and compare overlapping workstreams across several years.
Features
- 100% editable presentation template
- Compatible with Microsoft PowerPoint and Google Slides
- 16:9 aspect ratio slides
- Scalable vector shapes, icons and illustrations
- AI-Ready for Microsoft Copilot and Claude
- Instant access and download
Frequently asked questions
Q: How should a presenter explain a Gantt chart without overloading the audience?
A: Start by naming the time scale, then explain the task rows, then point to the most important overlaps or deadlines. In this template, the weekly, monthly, and multi-year layouts keep the same left-to-right reading pattern, so the audience can quickly understand what starts first, what runs in parallel, and what extends longest.
Q: Who is this template best suited for during a project discussion?
A: This template fits project managers, consultants, operations leads, and team supervisors who need to make a schedule visible to nontechnical stakeholders. It is strongest when the discussion is about timing, duration, sequencing, or workload across days, months, or years, rather than detailed financial analysis or task-level documentation.
Q: Why use horizontal Gantt bars instead of a simple task list?
A: A task list tells the audience what must be done, but the Gantt bars show when each activity happens and how long it lasts. The grid metaphor turns time into a visual ruler, making overlaps, gaps, and long-running workstreams easier to compare during a planning meeting.
Simple Gantt Chart PowerPoint Template
6-slide Gantt chart presentation template for project planning, weekly schedules, and multi-year timelines
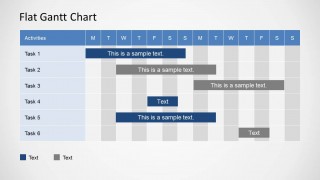
Simple Gantt Chart PowerPoint Template is a 6-slide planning deck for project managers and business teams. It includes weekly Gantt charts, a weekday task grid, a monthly roadmap, a 28-day schedule, and a multi-year plan. The template is built for Microsoft PowerPoint and Google Slides.
- Category
- Timelines & Planning
- Rating


 Loading...
- Aspect ratio
- 16:9
- Item ID
- 6538-02
- Colors
 Microsoft PowerPoint
  Microsoft Copilot
  Claude for PowerPoint
 Other formats supported
Subscribe today and get immediate
access to download our PowerPoint templates.