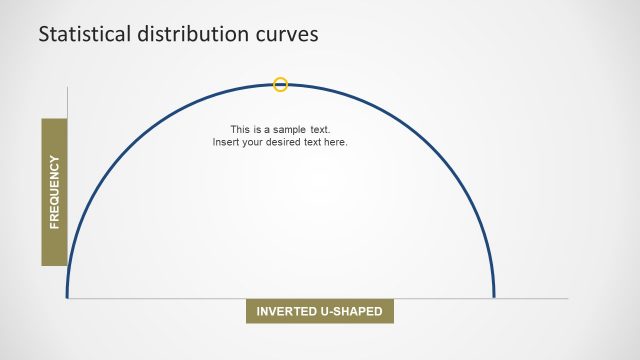
Square Shape Pressure Performance Relation
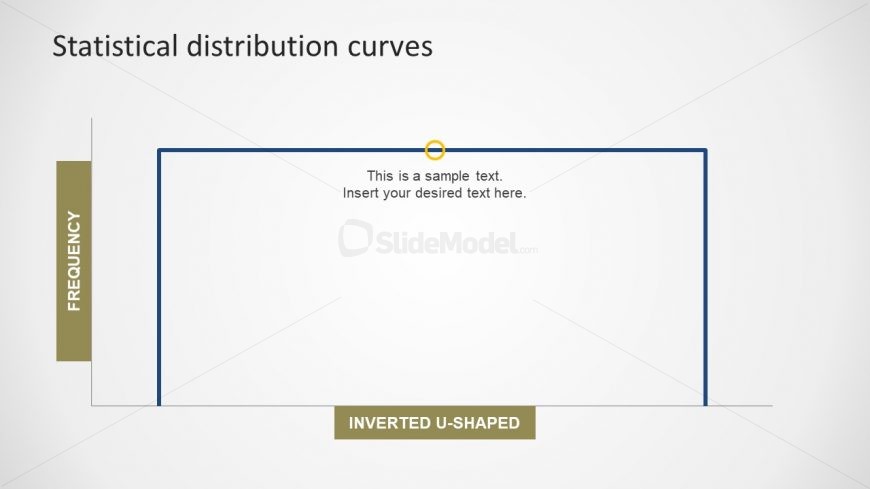
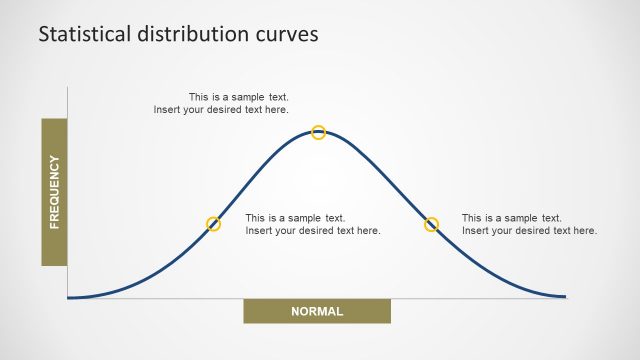
This creative slide of Square Shape Pressure Performance Relation is the variation on inverted U shaped curve chart. This template shows peak level as a moderate level of pressure. However, the points with too much or too little pressure cause the performance to decline. The left slide indicated low or now pressure, whereas, the right shows intensity of pressure. The square shape gives a neat effect to the slide. This invert U shape square has editable objects like the square shape of distribution which is resizable. Also, change the font size and style for the text placeholders and label bars.
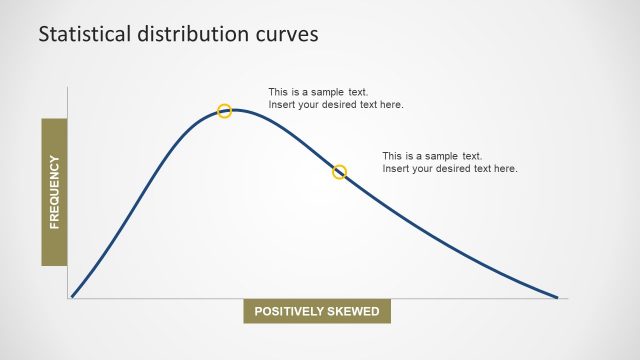
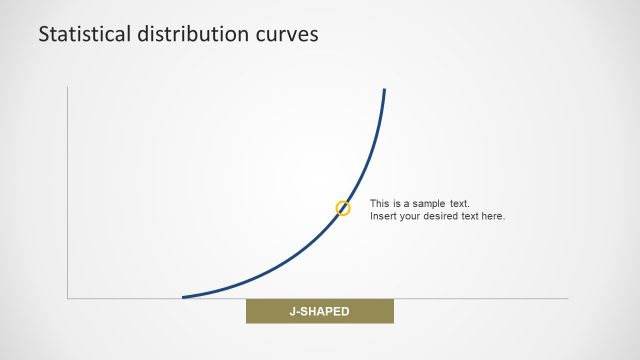
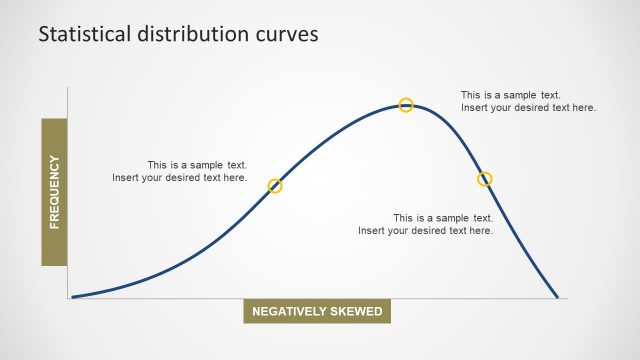
Return to Statistical Distribution PowerPoint Curves.