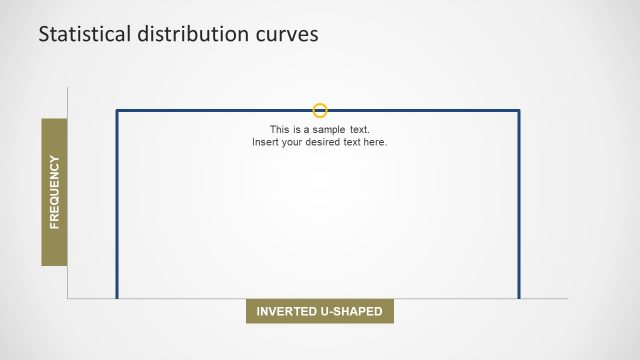
Inverted U Shape Data Distribution
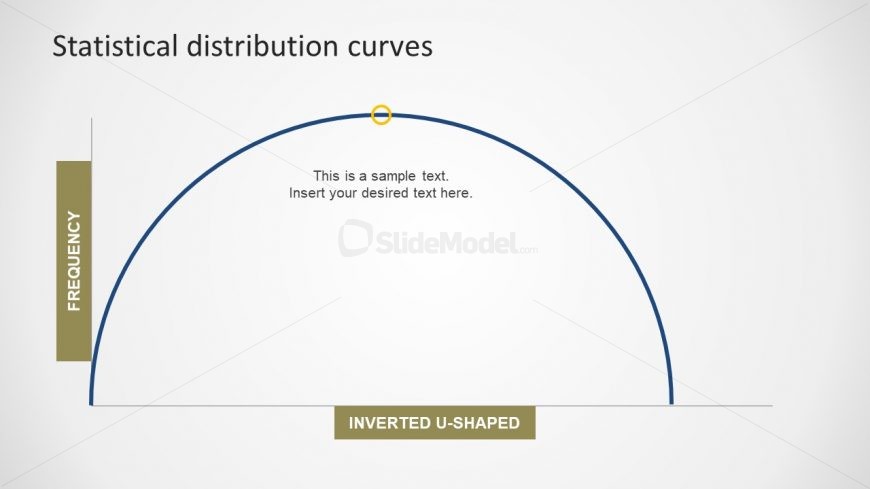
The Inverted U Shape Data Distribution is a statistical analysis graph known as Kuznets curve. It is the hypothesis for the economic development where there is a progressive increase and then a decrease in market demand. Also, the inverted U shows the performance as gradual improvement, reach an optimal path and decline. This is the editable PowerPoint slide with the shape of semi-circle. However, users can change the curve by rotating and resizing. The rectangular label shapes and circular icons on the curve are also customizable. For instance, alter the color or size, edit the textual content of the slide and more.
Return to Statistical Distribution PowerPoint Curves.