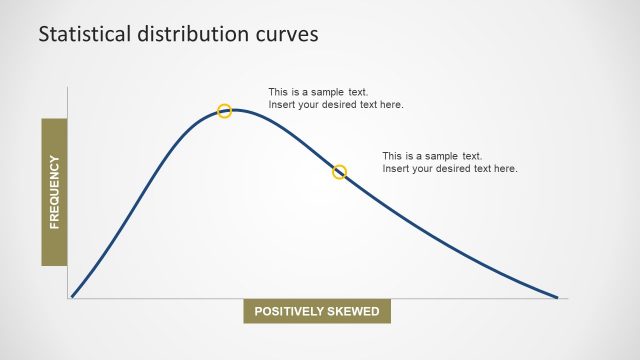
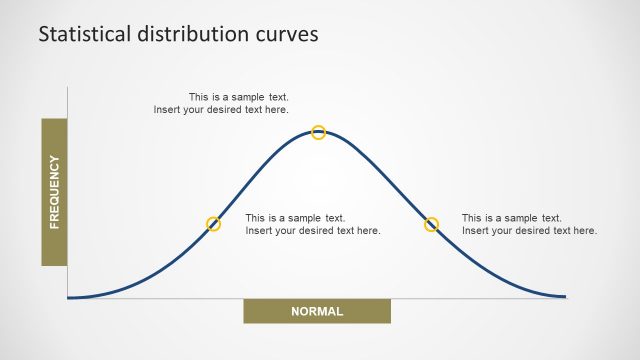
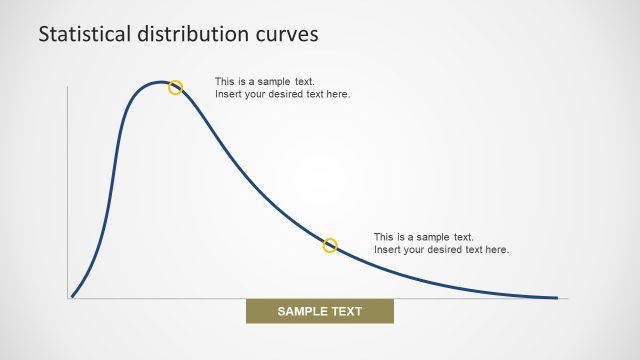
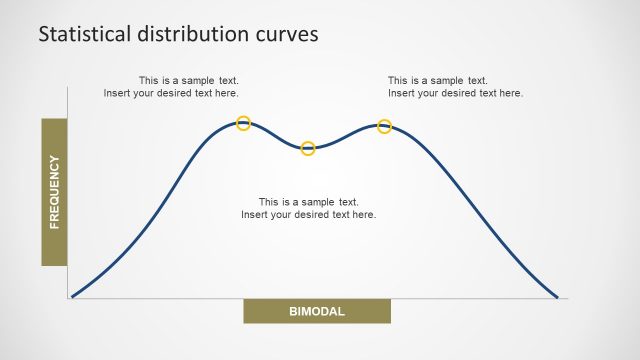
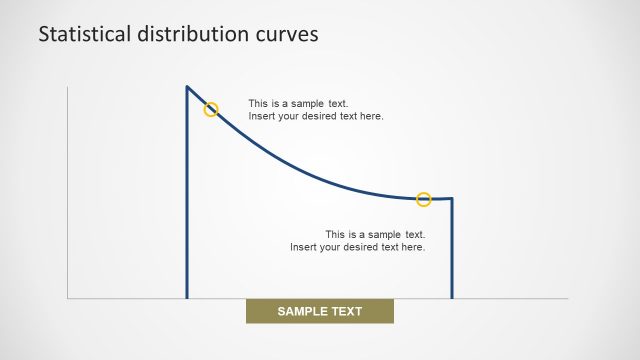
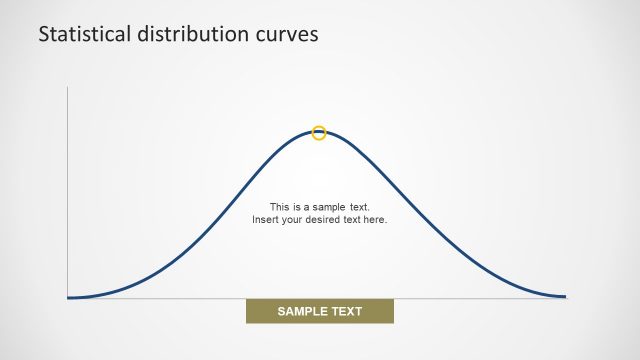
Distribution of Data Graphical
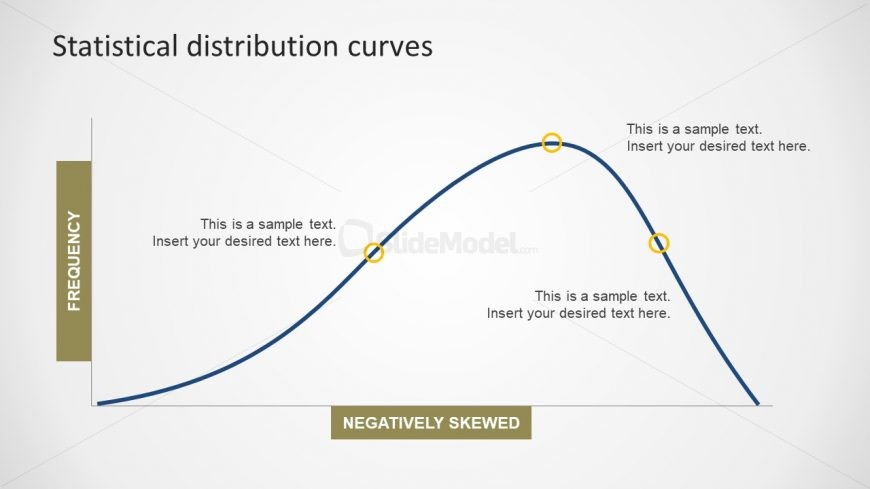
The slide of Distribution of Data Graphical is negative skew with a long, left tail, the mean and median template. It is the average cube deviation of mean and standard deviation. When the result is less than zero, it is negatively skewed. This PowerPoint is fully customizable presentation with various options to change the design aspects. For instance, change the plain gray background from the background option in design menu. Also, there is an option to add picture, texture and gradient effect to the background. Similarly, alter the colors of PowerPoint objects like curve line, circular icons and label bars.
Return to Statistical Distribution PowerPoint Curves.