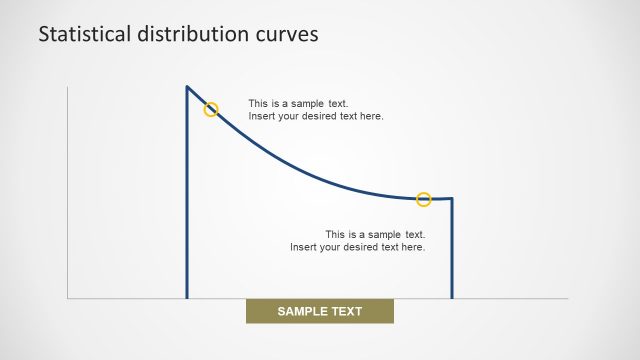
J Shape Situational Diagram
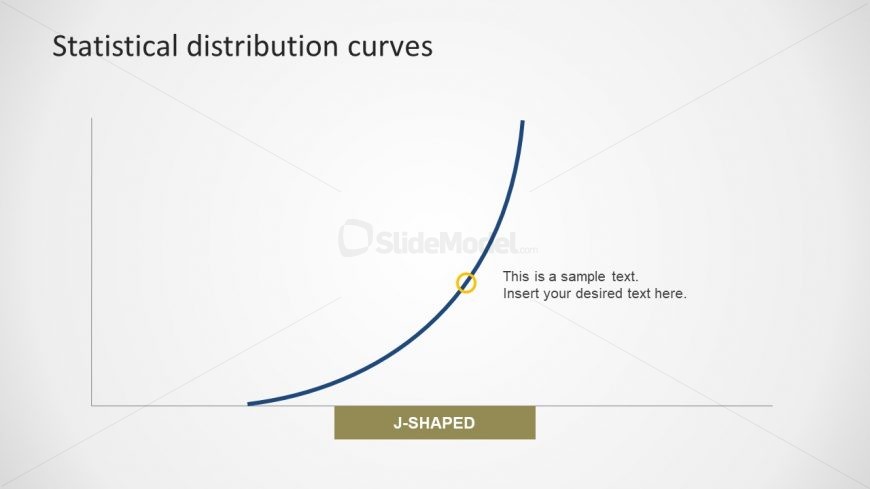
This slide of J Shape Situational Diagram is a simple graphical presentation of an important statistical concept. The J-shape curve chart is made when the there is a rapid increase in growth or development in exponential or logarithmic form. However, it stops shortly with the change in environment or other reflecting factors. Similarly, in the economic and finances, the J curve is useful in presenting trends analysis. Also, the editable PowerPoint enables users to change the design properties of template. Such as, changing the color or size of J curve or rotate the curve and adjust it as needed.
Return to Statistical Distribution PowerPoint Curves.