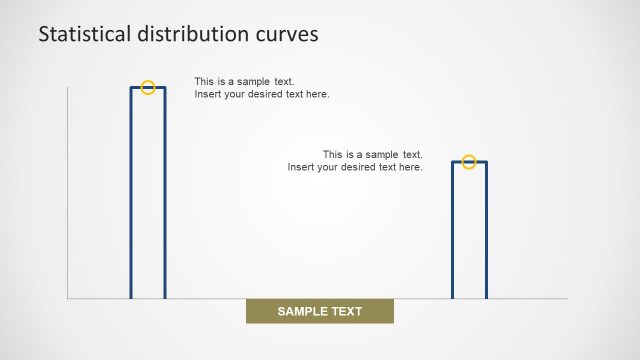
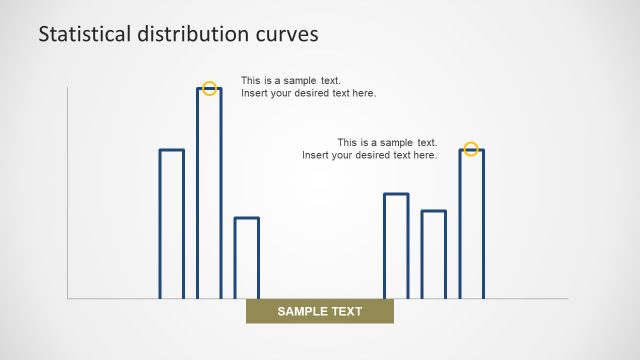
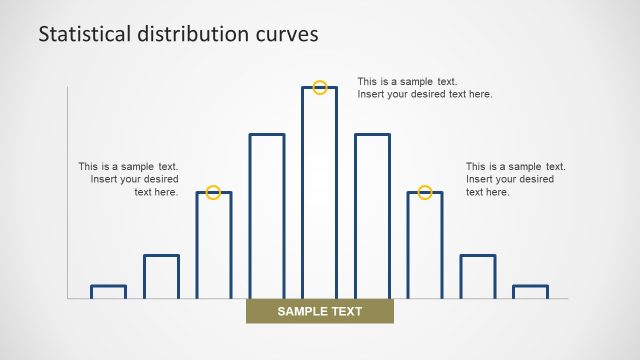
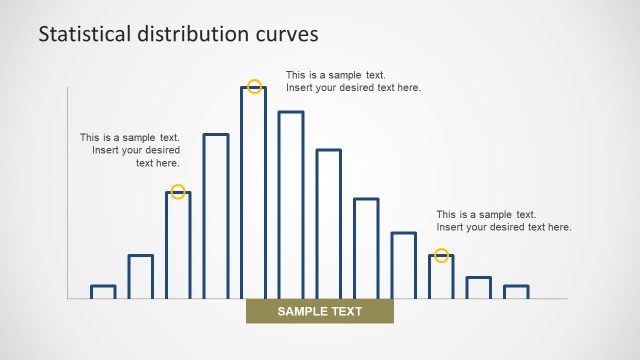
Editable Sample Bar Shapes
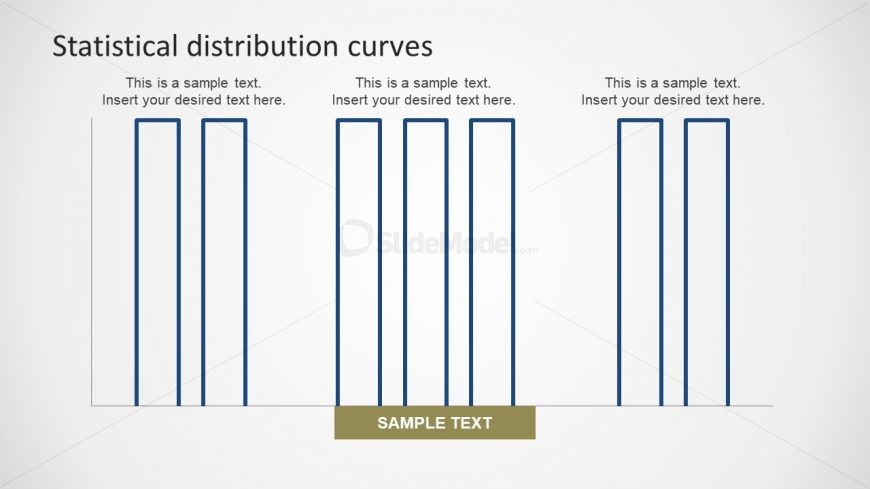
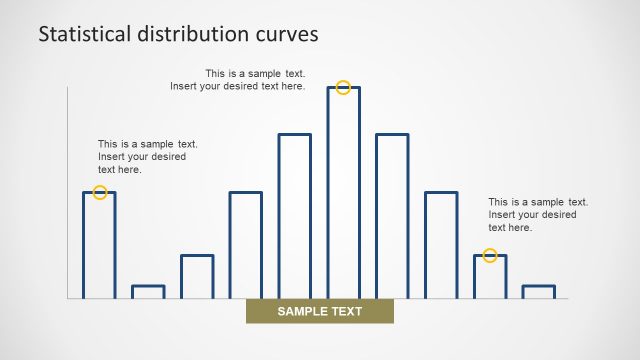
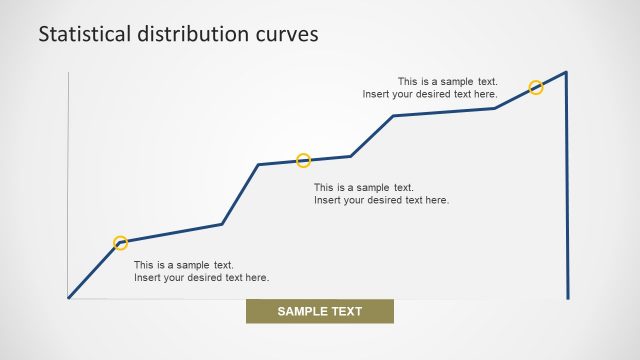
The Editable Sample Bar Shapes slide contain the reusable graph to show comparisons between the categories of data. Rotate the graph to make it horizontal or vertical. The bar graph can present changes over the period of time. For example, yearly sales of company or statistical report of progress in an industry over the decays. The editable bar chart shows the frequencies or mean of data. This slide lets users make designing changes in the PowerPoint. For instance, change the plain gray background by changing the colors or adding texture and pictures.
Return to Statistical Distribution PowerPoint Curves.