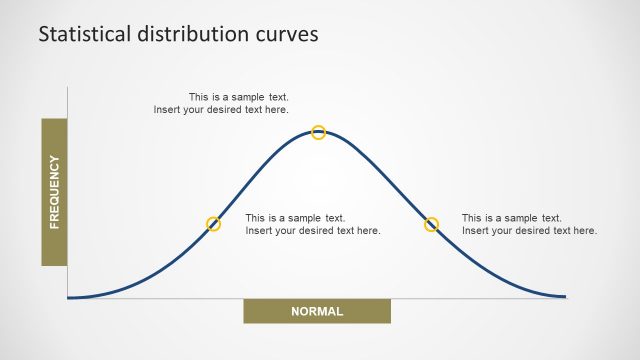
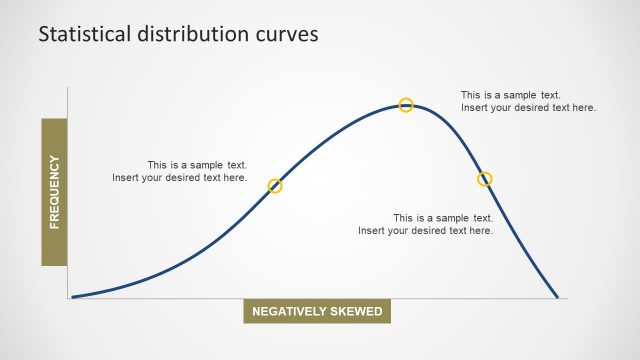
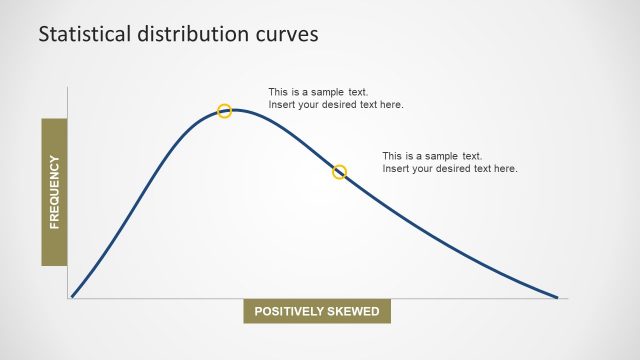
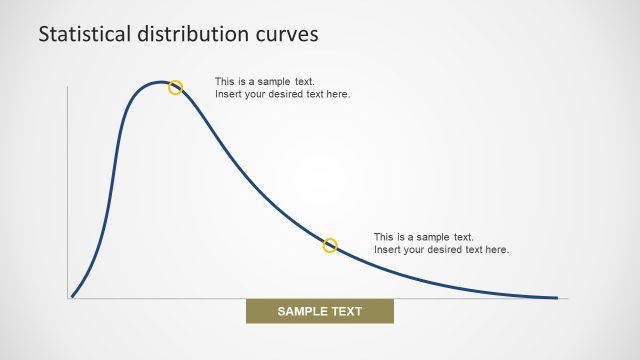
Skewed Curve Bell Shape
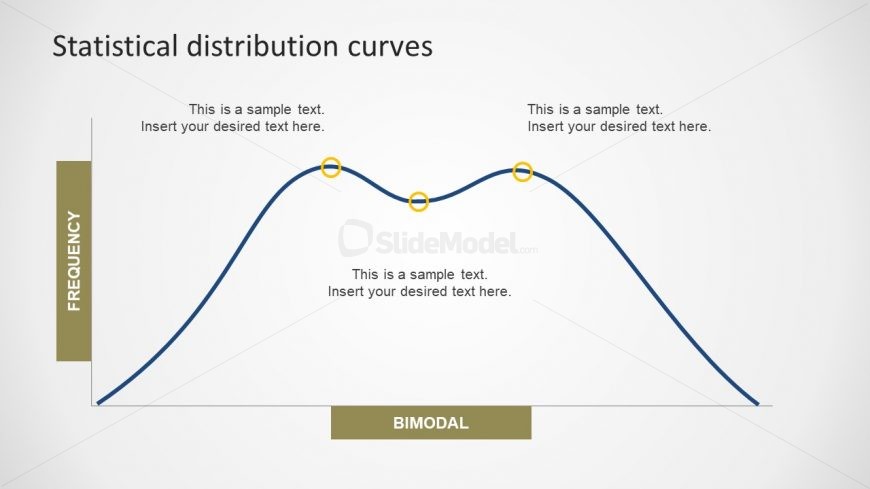
The double peak Skewed Curve Bell Shape chart is a bimodal distribution which looks like two-humped camel. This template is useful for many industries to display the report of probable events graphically. This template is usable in other presentations by copying slide. Also, the users can add and edit the labels of both x-axis and y-axis. Further, the color theme and size of the chart are also customizable. For instance, go to the design menu and open the dropdown menu of variants. Click the desire theme or customize one if necessary.
Return to Statistical Distribution PowerPoint Curves.