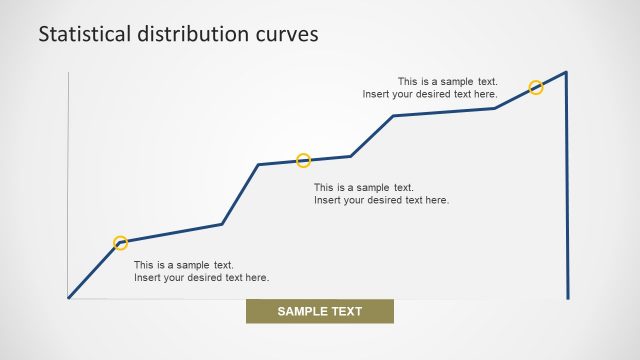
Slope Presented in Histogram

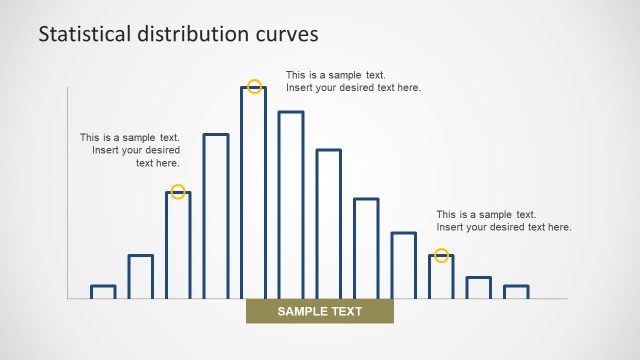
The outstanding PowerPoint slide of Slope Presented in Histogram is a statistical distribution curve. It displays the inverted yield curve graph to explain the interest rate. Here, the long-term debts have lower yield compare to the short-term dept. This PowerPoint template lets users copy slides to their ready-made presentations. For example, for the graphical presentation of finance and economical concepts, use the yield curve graph. The Statistical Distribution PowerPoint has the amazing editable objects such as curve line, pointer icons and label bar. This way, it is easier to change and replace items in the presentation.
Return to Statistical Distribution PowerPoint Curves.