Statistical Bias PowerPoint Templates
The Statistical Bias PowerPoint Templates are creative presentations for data analysis and surveys. Bias is a tendency to over or under-estimate the value of population parameters during sample surveys. There are different types of statistical bias. And this PowerPoint template provides a visual representation of these biases. These data biases are used in everyday life including online analytics. This statistical presentation covers the most common bias for data science and analytics. These include:
- Recall Bias: When the source doesn’t remember events correctly.
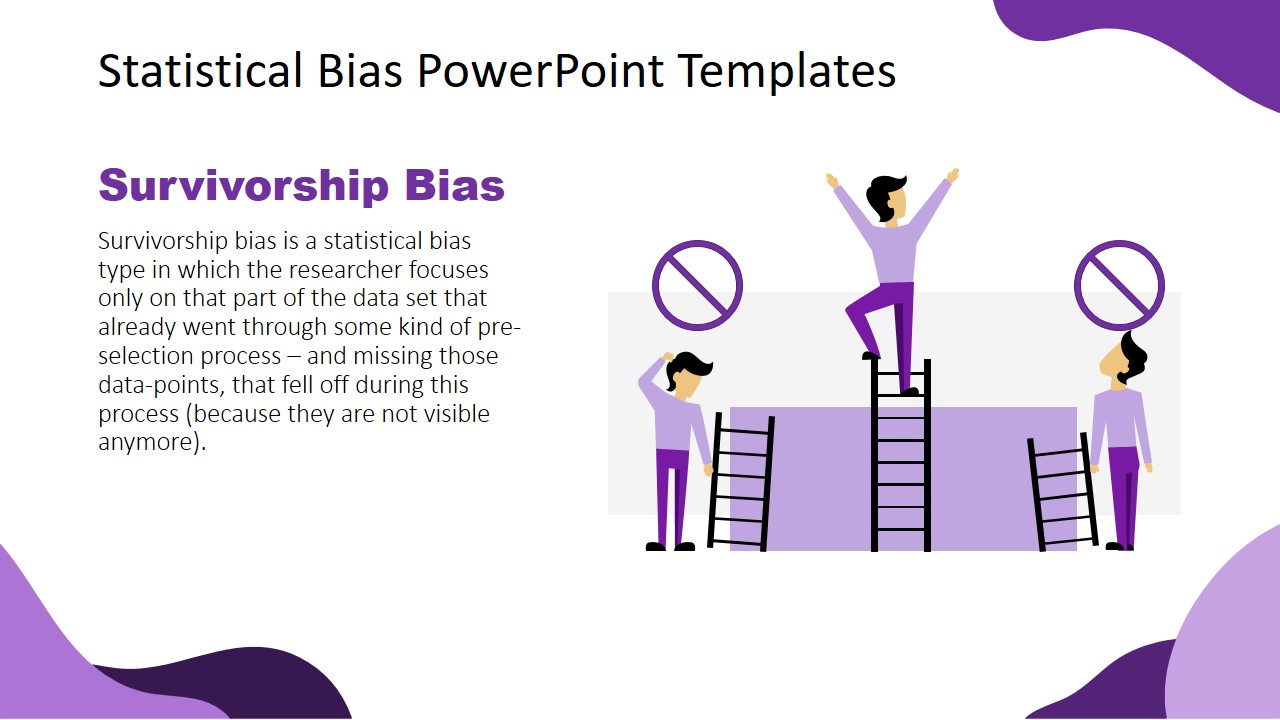
- Survivor Bias: Only consider dataset that passes through some pre-selection process.
- Omitted Variable Bias: When source leaves out one or more important variables
- Observed Bias: When researcher subconsciously projects own expectations into the research
- Funding Bias: When the results of research or survey are biased to support financial sponsors.
The template of statistical bias contains 7 slides of cartoon clipart shapes. These graphics, not only aid in getting the message across audiences but also provide strong visual aid. Because viewers can grasp the idea of discussing by viewing its visual representation. The PowerPoint template uses modern graphics in statistical data presentation to produce clear and concise information. The goal here is to educate audience about multiple bias types for research and analysis purposes.
The Statistical Bias PowerPoint Templates contain bold color themes and compelling graphics. These modern graphics are fully editable PowerPoint shapes. And users can customize themes, shape colors, size, text, etc. from available formatting options. Further, users can add shape effects and animations to enhance its visuals.


