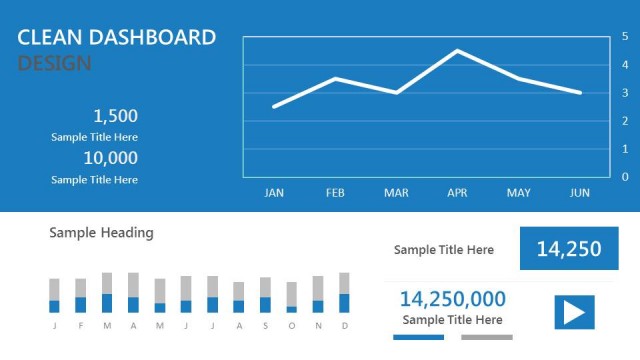
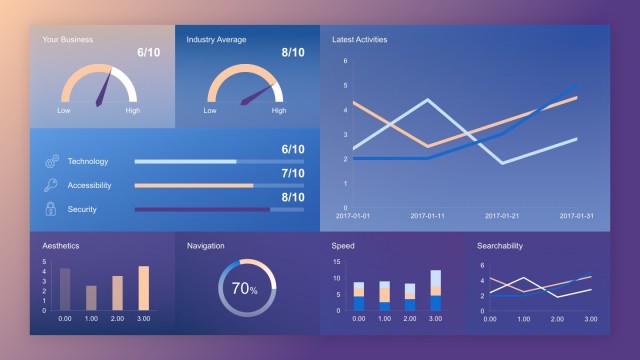
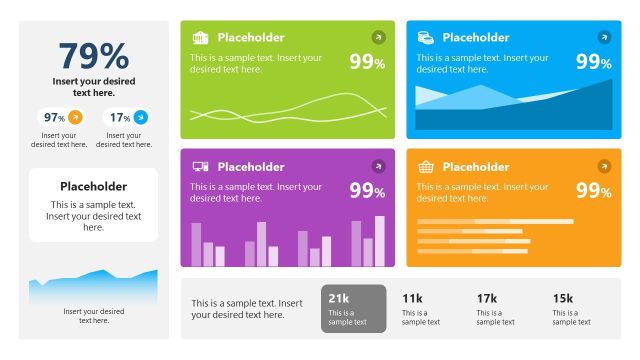
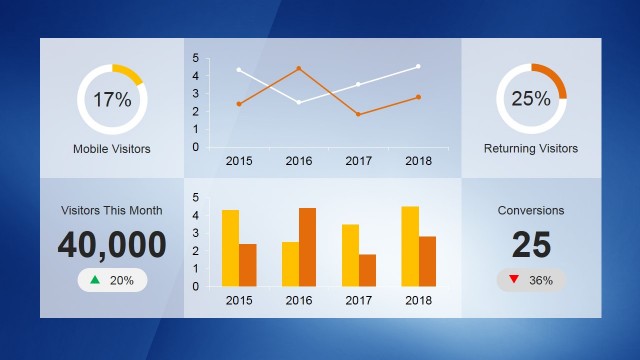
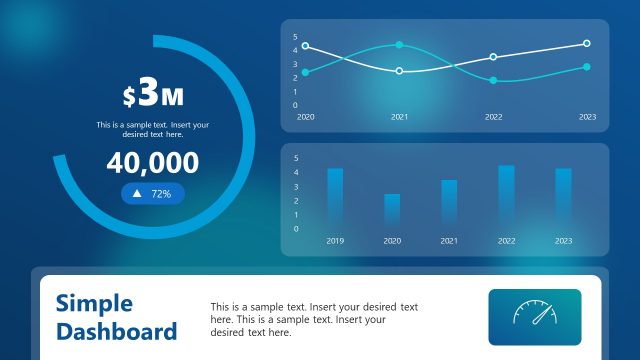
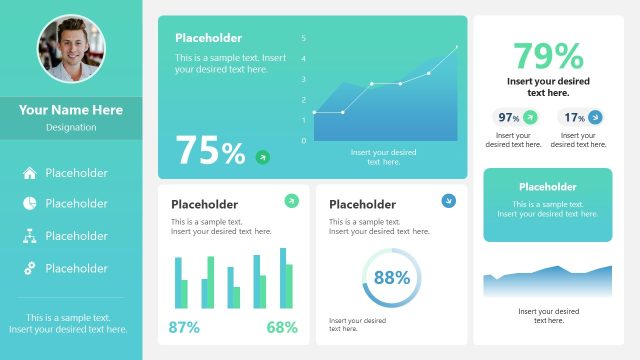
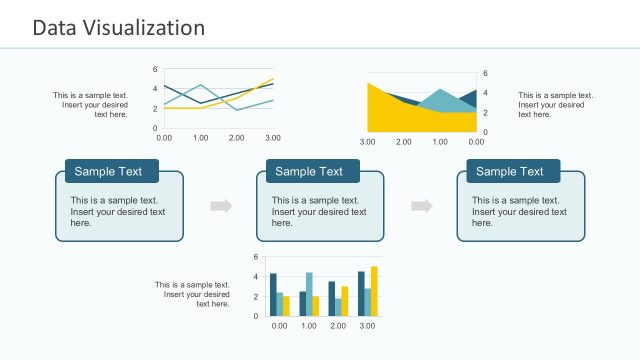
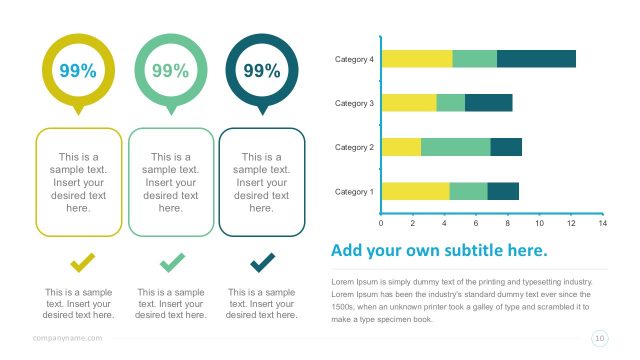
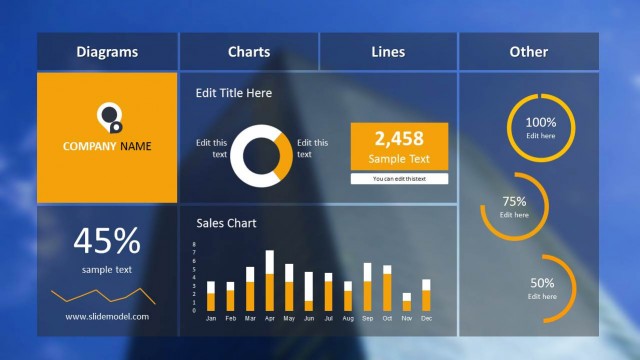
This is a data-driven dashboard template for PowerPoint with a clean green style. You can use this data-driven template for PowerPoint presentations to prepare awesome dashboards showing the KPI and business performance in a PowerPoint slide. This is perfect to make dashboard reports in PowerPoint, Google Slides and Canva presentations.
Clean Dashboard PowerPoint template contains different slide designs with custom layouts to help you preparing awesome dashboards in PowerPoint with unique styles. The top section of the dashboard template contains a green background, and the bottom area a light color.
Alternatively, you can download other creative and editable dashboard PPT templates, ready for PowerPoint, Google Slides and Canva presentations.
What’s inside this template
Example presentation scenarios
- A business analyst can present a monthly performance update to leadership using the line chart, monthly bar chart, and KPI cards to compare trends against current results.
- A sales manager can brief regional teams on pipeline or revenue movement using the numeric cards, progress bar, and donut indicators to keep attention on a few priority measures.
- An operations leader can report service or production metrics in an executive meeting using the split dashboard layout with an area chart and three donut KPIs.
- A project manager can summarize status metrics for stakeholders using the dashboard title area, trend line, and large number callouts to separate headline results from supporting data.
Features
- 100% editable presentation template
- Compatible with Microsoft PowerPoint and Google Slides
- 16:9 aspect ratio slides
- Scalable vector shapes, icons and illustrations
- Data-driven charts, editable in Microsoft Excel
- AI-Ready for Microsoft Copilot and Claude
- Instant access and download
Frequently asked questions
Q: How should a presenter organize the dashboard message so the audience does not focus only on the charts?
A: Start each slide with one headline finding, then use the largest KPI card or the top line chart as evidence. The smaller bar, area, donut, and progress elements should support that main point rather than compete with it. Keep labels short and reserve spoken commentary for the reason behind the change.
Q: Who is this template best suited for in a business review?
A: This template is best for analysts, managers, and department leads who need to report measurable performance without building a long narrative deck. The visible KPI cards, monthly trend charts, donut indicators, and progress bars fit meetings where executives need a quick read on status, movement, and priority metrics.
Q: Why does the design place trend charts and KPI cards in large teal-and-white blocks?
A: The teal header blocks create a clear visual zone for primary trend data, while the white lower sections separate supporting metrics and summaries. This structure helps audiences scan from the main line chart to the KPI cards, then down to bar, area, or donut details without losing the hierarchy of the report.


Clean Dashboard Template for PowerPoint
4-slide dashboard presentation template with line charts, KPI cards, donut metrics, and monthly performance visuals
Clean Dashboard Template for PowerPoint is a 4-slide data dashboard presentation template with line charts, monthly bar charts, area charts, donut KPIs, numeric cards, and progress bars. It is designed for business performance reporting by analysts, managers, and executives in Microsoft PowerPoint and Google Slides. Chart data can be edited as an Excel spreadsheet in PowerPoint.
- Category
- Data & Charts
- Rating


 Loading...
- Aspect ratio
- 16:9
- Item ID
- 330-01
 Microsoft PowerPoint
 Microsoft Copilot
 Claude for PowerPoint
Other formats supported
Subscribe today and get immediate
access to download our PowerPoint templates.