KPI Dashboard Template for PowerPoint
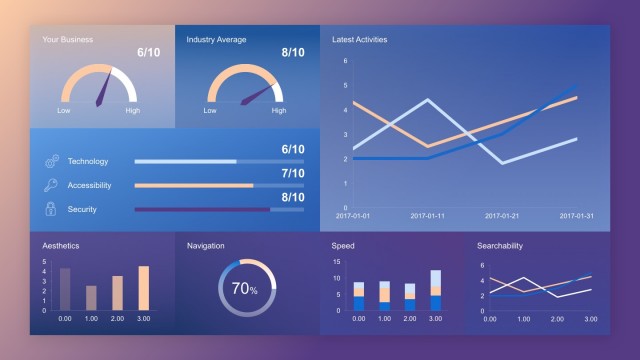
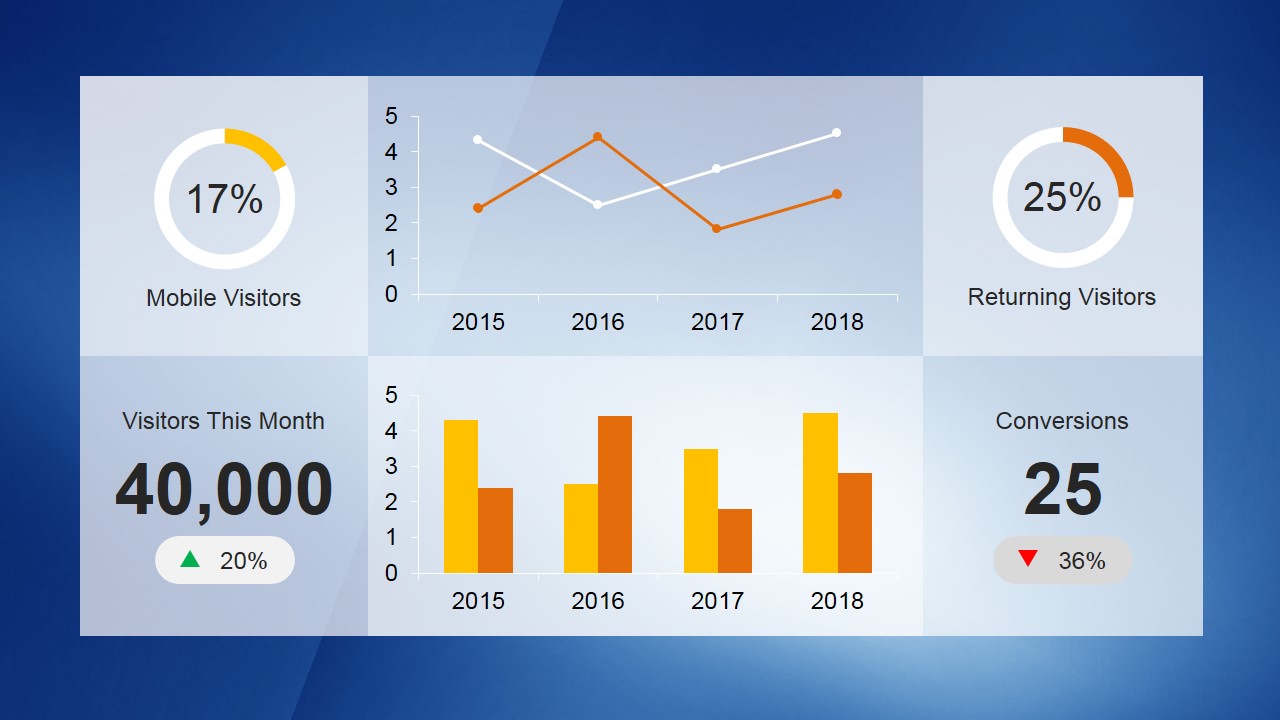
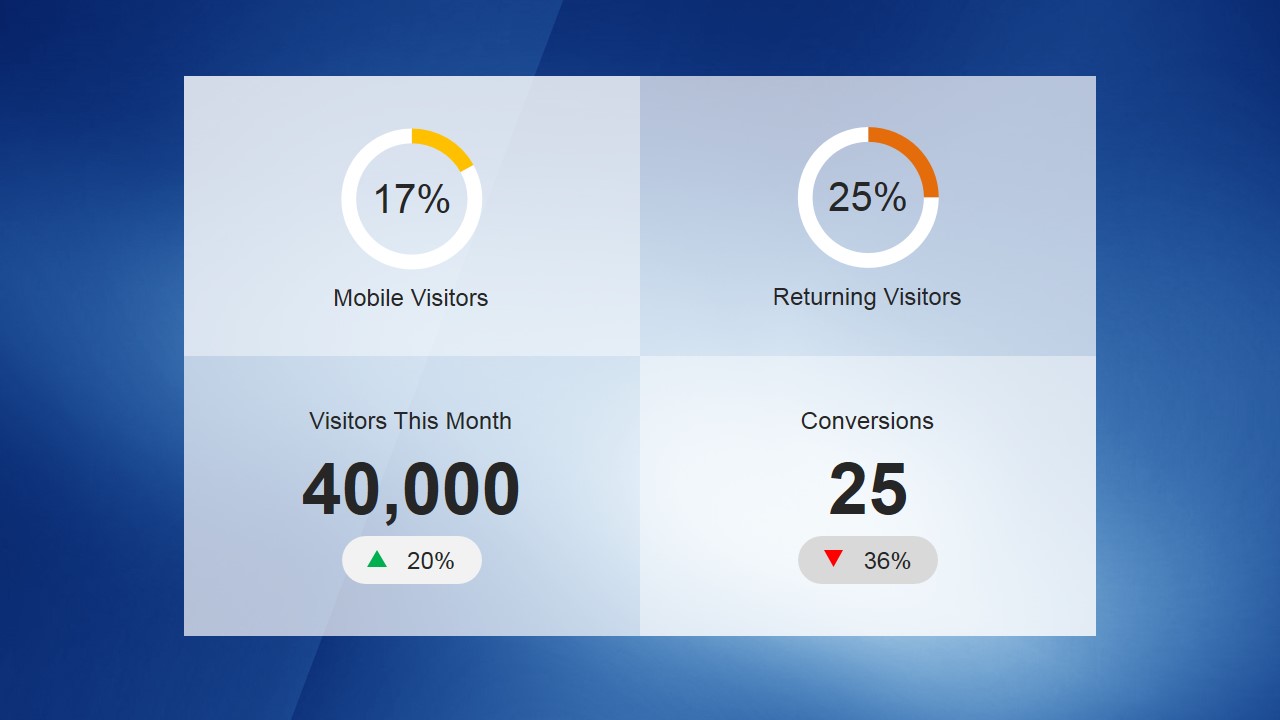
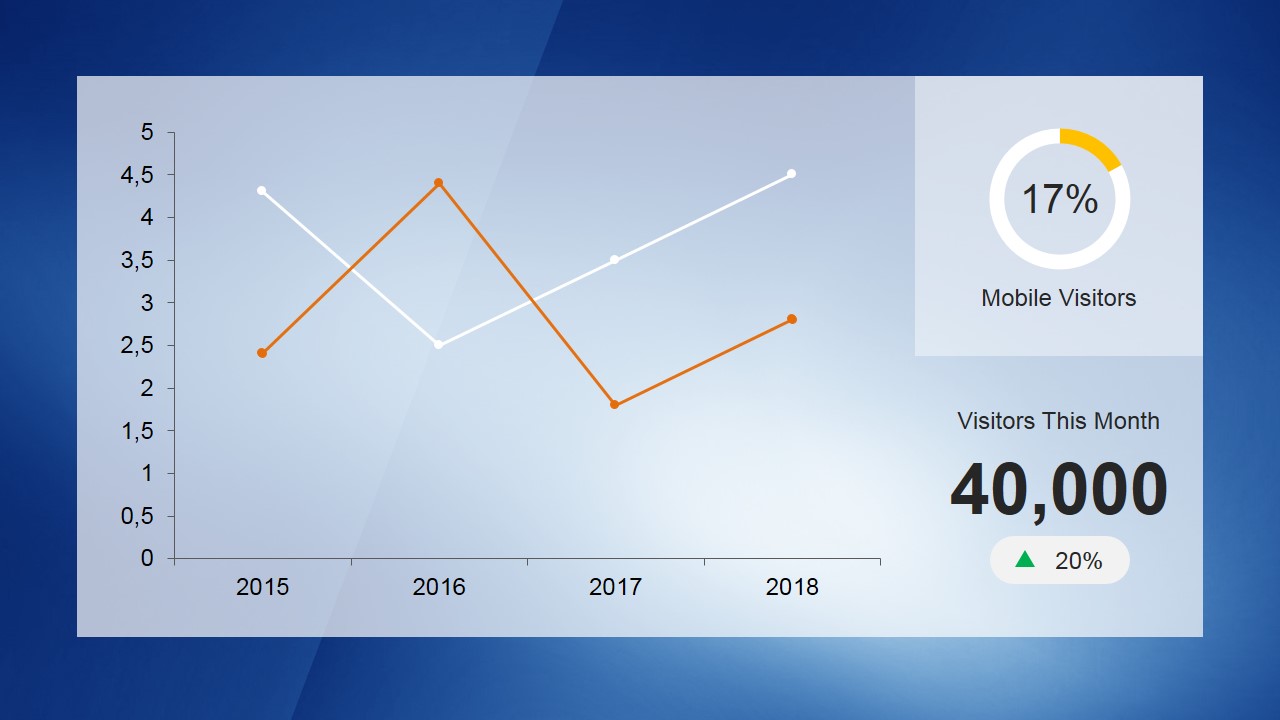
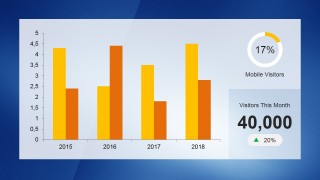
KPI Dashboard Template for PowerPoint is a professional presentations with a simple 2 variables dashboard (traffic vs conversion) and different visual representations of their evolution. The dashboard contains six basic components (amount of traffic and conversions represented as a donut chart, traffic and conversions against time represented with a line chart and a bar chart both with future forecast and absolute numbers describe actual values.
The dashboard components are fully data driven so the presenter can edit the values though the use of excel and the template charts will recalculte the figures. All text and shapes where created using PowerPoint objects, so the user can edit their appearance and change the full dashboard context with no effort.
Create amusing dashboard presentations, with relevant key performance indicators with our KPI Dashboard Template for PowerPoint.
This template also provides an animated version where animation effects are placed in the charts in the first slide.


You must be logged in to download this file.
DOWNLOAD- Category
- Data & Charts
- Rating


 Loading...
- Size
- 16x94x3
- Item ID
- 6576-01
- Colors
Subscribe today and get immediate
access to download our PowerPoint templates.