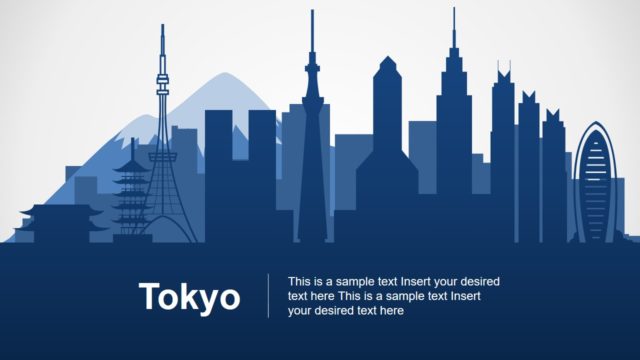
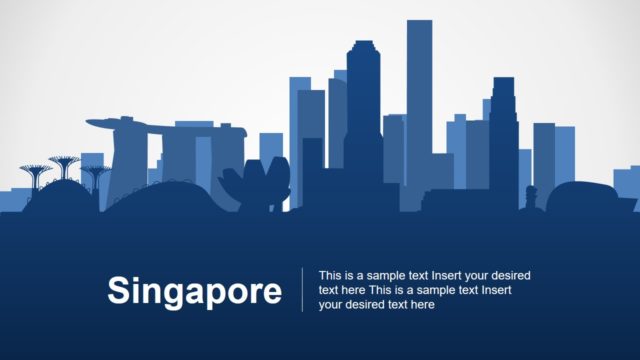
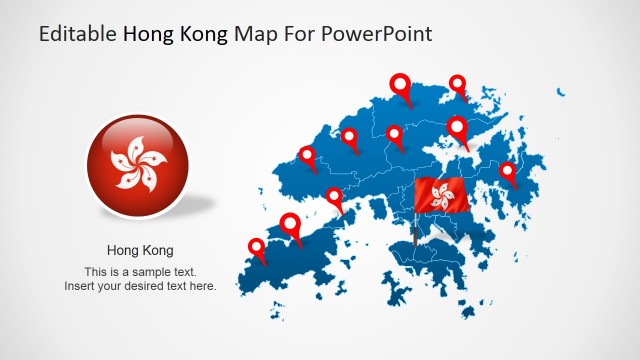
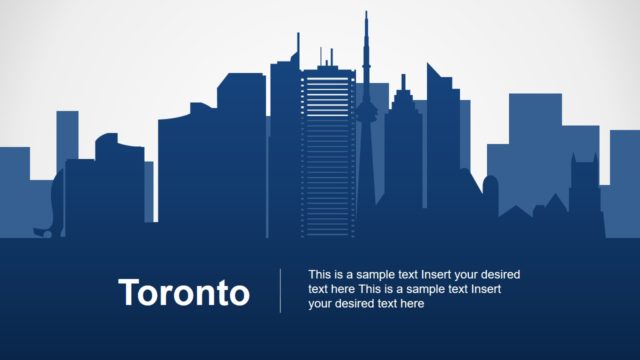
The Shanghai PowerPoint Template is a set of city skyscraper and editable maps. This template contains 8 slides with multiple silhouette designs for geographic maps, landmarks, and statistical chart. Shanghai is China’s financial hub and biggest city with many attractive tourist locations around the city. It is located in central East China at largest port close to Beijing and Hong Kong. The editable map of Shanghai display districts and attraction areas of Chinese metropolitan city. Here, one slide shows Oriental Pearl TV Tower apart from city skyscraper slides.
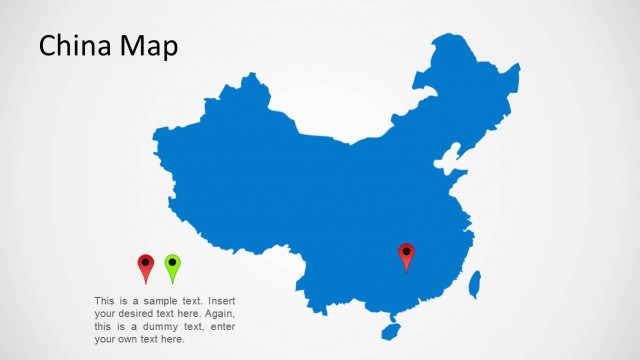
The Shanghai PowerPoint Template includes multiple clipart icons to complement map designs. For example, different shapes and sizes of location pin markers to highlight particular geographic area. There are two bonus slides which show Shanghai as a part of complete editable map of China. Although the template has blue and gray silhouette maps and graphics. The users can choose different colors from shape fill option in PowerPoint. Moreover, the view of silhouette city skyscraper is made up of individual icons. Therefore, changing colors of individual elements can help users to create a colorful Shanghai PowerPoint template.
The map template of Shanghai is suitable for a range of presentations including business reports, marketing, geographic education, and tourism. The last slide of Shanghai PowerPoint template provides a data-driven multiple bar chart. This will help update graphical chart by simply editing data values.
What’s inside this template
Example presentation scenarios
- A market analyst can use the China locator map and Shanghai map callouts to explain where a proposed regional initiative is concentrated.
- A tourism marketer can present destination highlights by placing pins on the Shanghai map and using the Oriental Pearl Tower slide as a recognizable landmark opener.
- A geography teacher can use the China map, Shanghai district map, and skyline silhouette to introduce the city in a visual classroom overview.
- A business development manager can pair the pinned Shanghai map with the bar chart slide to connect target locations with performance or forecast figures.
Features
- 100% editable presentation template
- Compatible with Microsoft PowerPoint and Google Slides
- 16:9 aspect ratio slides
- Scalable vector shapes, icons and illustrations
- AI-Ready for Microsoft Copilot and Claude
- Instant access and download
Frequently asked questions
Q: How should a presenter organize a Shanghai briefing with this template?
A: Start with the skyline cover to frame the city, then use the Oriental Pearl Tower slide to add recognition and context. Move to the China map to orient the audience, then zoom into the Shanghai maps with pins and callouts. Close with the bar chart only after the audience understands the locations being measured.
Q: Who is this template best suited for?
A: This template fits presenters explaining Shanghai as a place, market, destination, or operating area. Tourism teams, educators, consultants, real estate groups, and business development presenters can use the maps, pushpins, and skyline visuals to make location the center of the message instead of treating it as background context.
Q: Why do the skyline and map visuals help communicate a Shanghai story?
A: The skyline creates instant city recognition, while the China and Shanghai maps answer the audience's where question. Pin markers turn geography into talking points, and the bar chart adds a measurable comparison after the spatial context is clear. This sequence reduces explanation time and keeps attention on place-based decisions.


Shanghai PowerPoint Template
8-slide Shanghai presentation template with city maps, skyline silhouettes, and landmark visuals
The Shanghai PowerPoint Template is an 8-slide city map and skyline presentation template for Microsoft PowerPoint and Google Slides. It includes a Shanghai skyline cover, Oriental Pearl Tower landmark slide, China and Shanghai maps with pin markers, a Shanghai district map with callouts, and a bar chart with data editable as an Excel spreadsheet in PowerPoint.
- Category
- Maps
- Rating

 Loading...
- Aspect ratio
- 16:9
- Item ID
- 20034-01
- Colors
 Microsoft PowerPoint
 Microsoft Copilot
 Claude for PowerPoint
Other formats supported
Subscribe today and get immediate
access to download our PowerPoint templates.