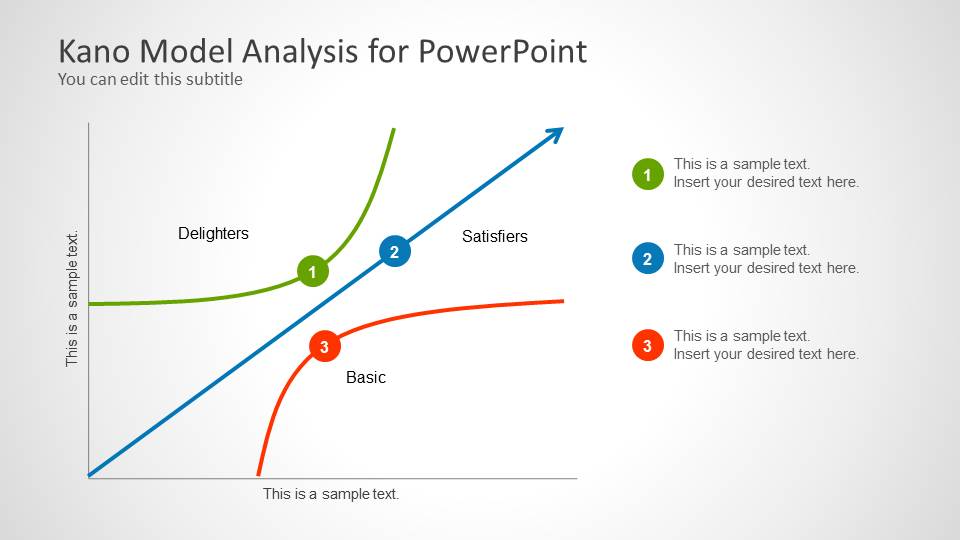
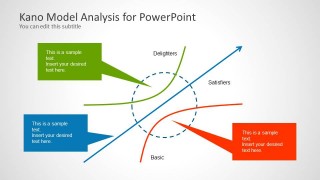
Kano Model Analysis for PowerPoint. Kano model is a theory used for product development and customer satisfaction. Kano model was developed in the 1980 by Noriaki Kano and the analysis using this model helps to classify the customer preferences into categories.
This Kano Model template for PowerPoint contains a curve design created with shapes and text boxes that you can edit to present a Kano Analysis in a PowerPoint presentation.
What’s inside this template
Example presentation scenarios
- A product manager can use the main curve diagram to explain how proposed features may affect customer satisfaction before a roadmap prioritization meeting.
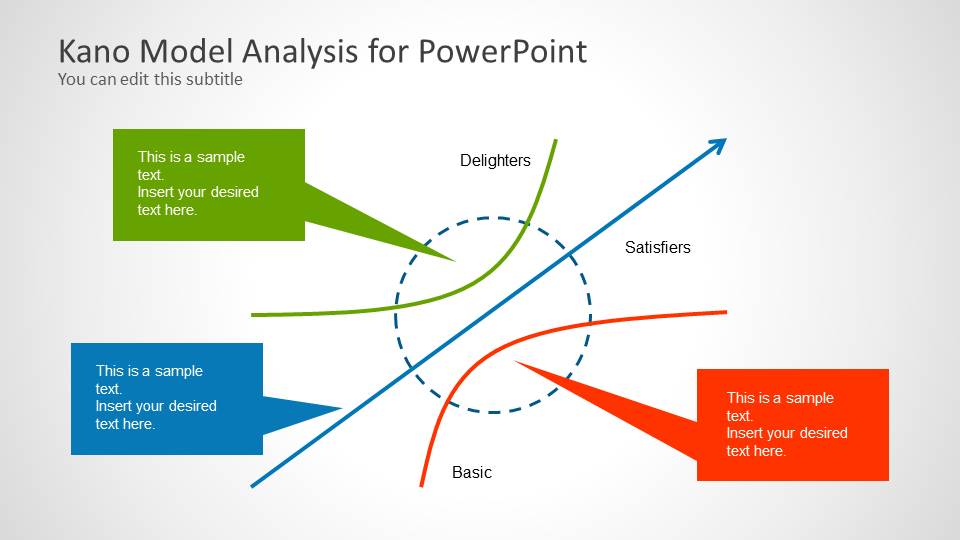
- A UX researcher can use the callout slide to connect survey findings or interview themes to Delighters, Satisfiers, and Basic expectations.
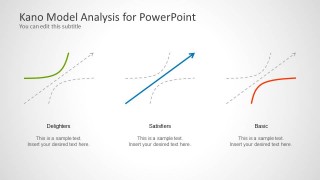
- A startup founder can use the three-column breakdown to show investors which features are must-haves, which improve perceived value, and which may create differentiation.
- A consultant can use the highlighted overlap diagram to guide a client workshop on where product investments should move from expected functionality to satisfaction drivers.
Features
- 100% editable presentation template
- Compatible with Microsoft PowerPoint and Google Slides
- 16:9 aspect ratio slides
- Scalable vector shapes, icons and illustrations
- AI-Ready for Microsoft Copilot and Claude
- Instant access and download
Frequently asked questions
Q: How should a presenter explain the Kano Model with this template?
A: Start with the full curve diagram to define the axes and the three satisfaction categories. Then use the highlighted circle or arrow callouts to focus discussion on the features under review. Close with the three-column breakdown so the audience can separate must-have basics, performance satisfiers, and potential delighters before making product decisions.
Q: Who is this template best suited for in a product discussion?
A: This template fits product managers, UX researchers, founders, and consultants who need to translate customer preferences into feature priorities. It works best when the audience already knows the product context but needs a shared model for deciding whether a feature is expected, satisfaction-building, or capable of surprising users.
Q: Why do the curved lines and callouts improve the explanation?
A: The curves show that satisfaction does not rise the same way for every feature type. A straight blue Satisfiers line suggests performance improvement, while the green and red curves show nonlinear effects for delighters and basic expectations. The callouts turn the abstract model into specific talking points without crowding the main diagram.


Kano Model Analysis for PowerPoint
4-slide presentation template for Kano Model curves, satisfaction drivers, and product development analysis
Kano Model Analysis for PowerPoint is a 4-slide template for explaining customer satisfaction drivers in product development. It includes a labeled Kano curve diagram, numbered category markers, a highlighted overlap diagram with callouts, and a three-part Delighters, Satisfiers, Basic comparison layout for Microsoft PowerPoint and Google Slides.
- Category
- Models
- Rating


 Loading...
- Aspect ratio
- 16:9
- Item ID
- 6072-08
- Colors
 Microsoft PowerPoint
  Microsoft Copilot
  Claude for PowerPoint
 Other formats supported
Subscribe today and get immediate
access to download our PowerPoint templates.