Slide 4 of 4 from Kano Model Analysis for PowerPoint
Kano Model Analysis PowerPoint Slide Design
Kano Model Analysis Diagram for PowerPoint
- Diagram
- Other
- Concept Explanation Slide
- 16:9
- 100% Editable
The Kano Model Analysis Diagram slide from the Kano Model Analysis for PowerPoint template offers a clear visual tool for customer satisfaction analysis. This slide uses editable shapes and vector icons to illustrate key product feature categories, supporting business presentations and pitch deck templates focused on stakeholder engagement and product strategy discussions.
What’s on This Slide
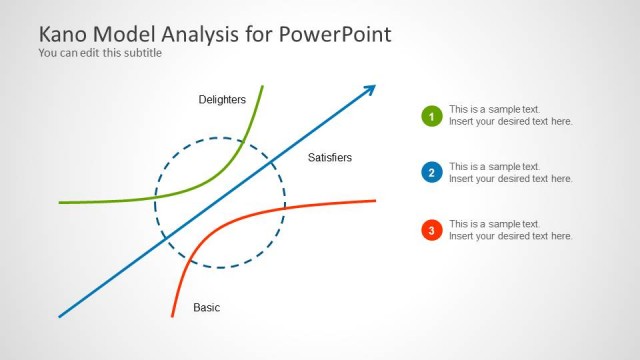
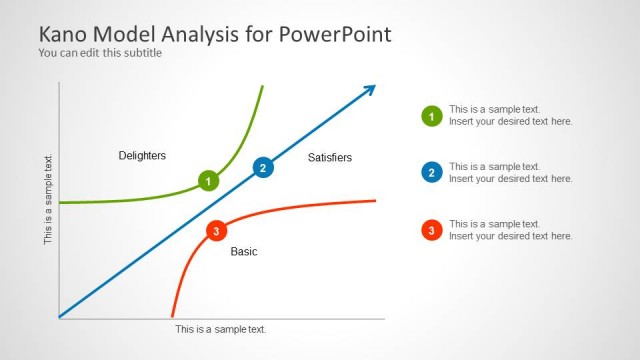
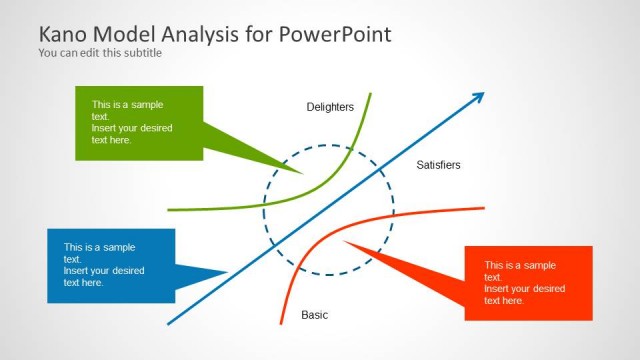
The slide features a diagram illustrating the Kano Model with three labeled sections: Delighters, Satisfiers, and Basic. Each section contains a unique curve representing customer satisfaction levels, with the Delighters section on the left, Satisfiers in the center, and Basic on the right. Text placeholders are positioned below each section for descriptions, aligned centrally. The background is light with a subtle gradient, enhancing the visibility of the curves. The visual hierarchy emphasizes the curves' flow, indicating increasing satisfaction levels from left to right.
How to Use It
This layout serves as a visual representation of the Kano Model, ideal for discussing customer satisfaction drivers in product development. It fits well in a presentation sequence following problem identification slides, providing clarity on how different product features impact customer perceptions. This structure is useful for workshops, strategy sessions, or stakeholder presentations focused on product development and customer experience analysis.
Text Placeholders & Capacity
Keep your copy within these limits so it fits without resizing. Node body slots can hold about 40 characters each.
| Placeholder | Count | Max characters (approx.) |
|---|---|---|
| Slide title | 1 | 30 |
| Subtitle | 1 | 50 |
| Item heading | 3 | 15 |
| Item body | 3 | 40 |
Slide Keywords
Download unlimited PowerPoint templates, charts and graphics for your presentations with our annual plan.
DOWNLOADReturn to Kano Model Analysis for PowerPoint.