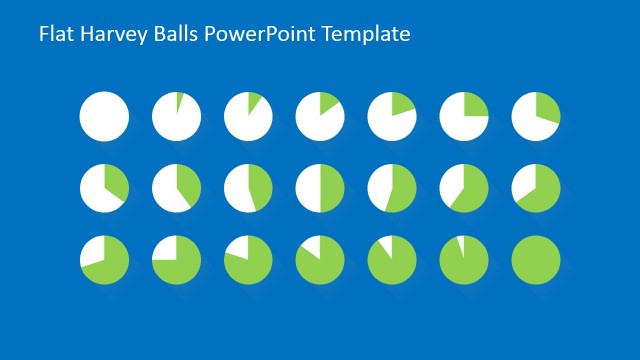
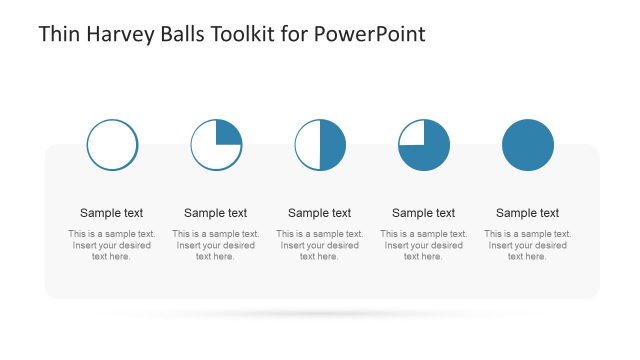
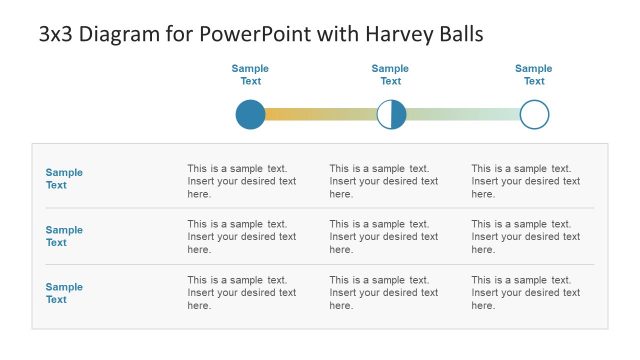
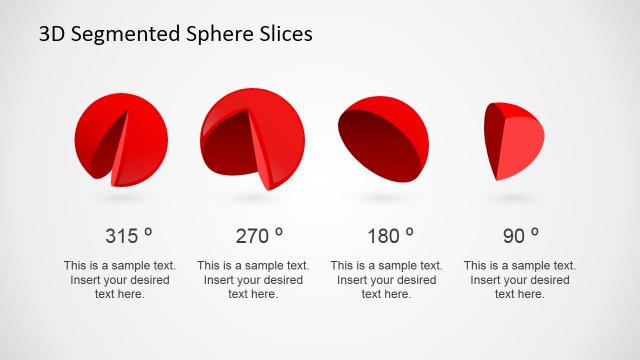
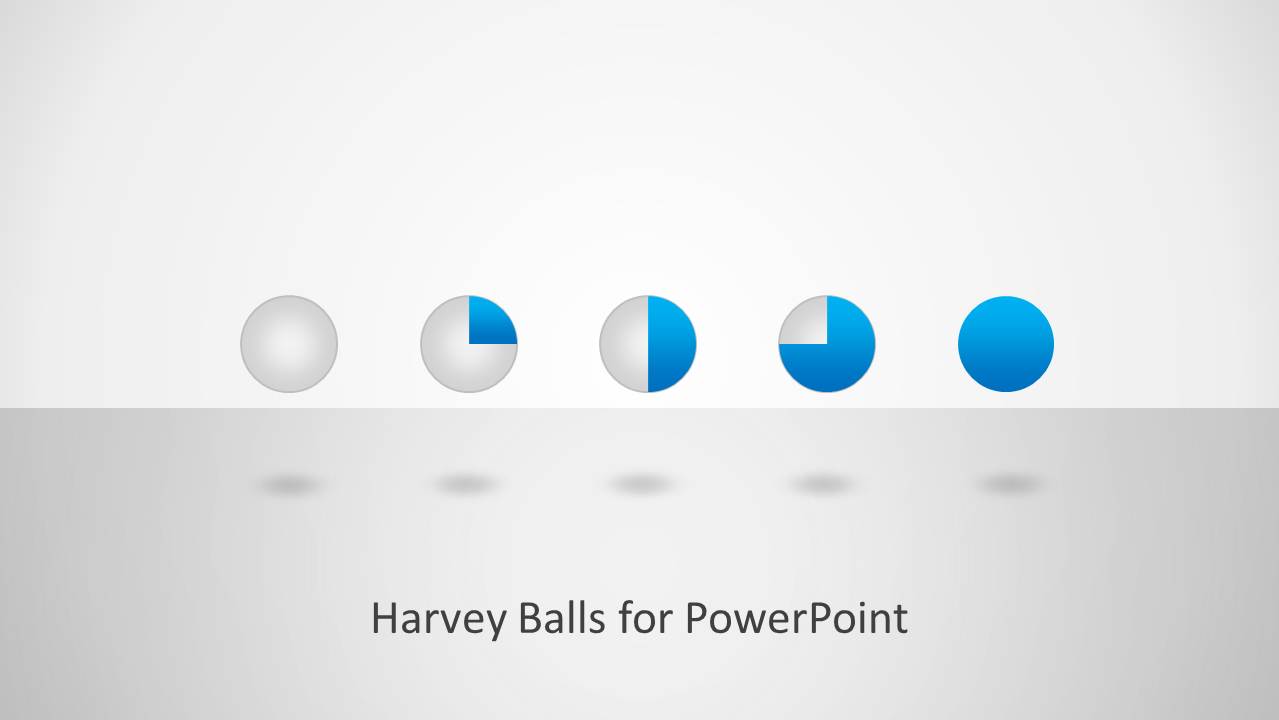
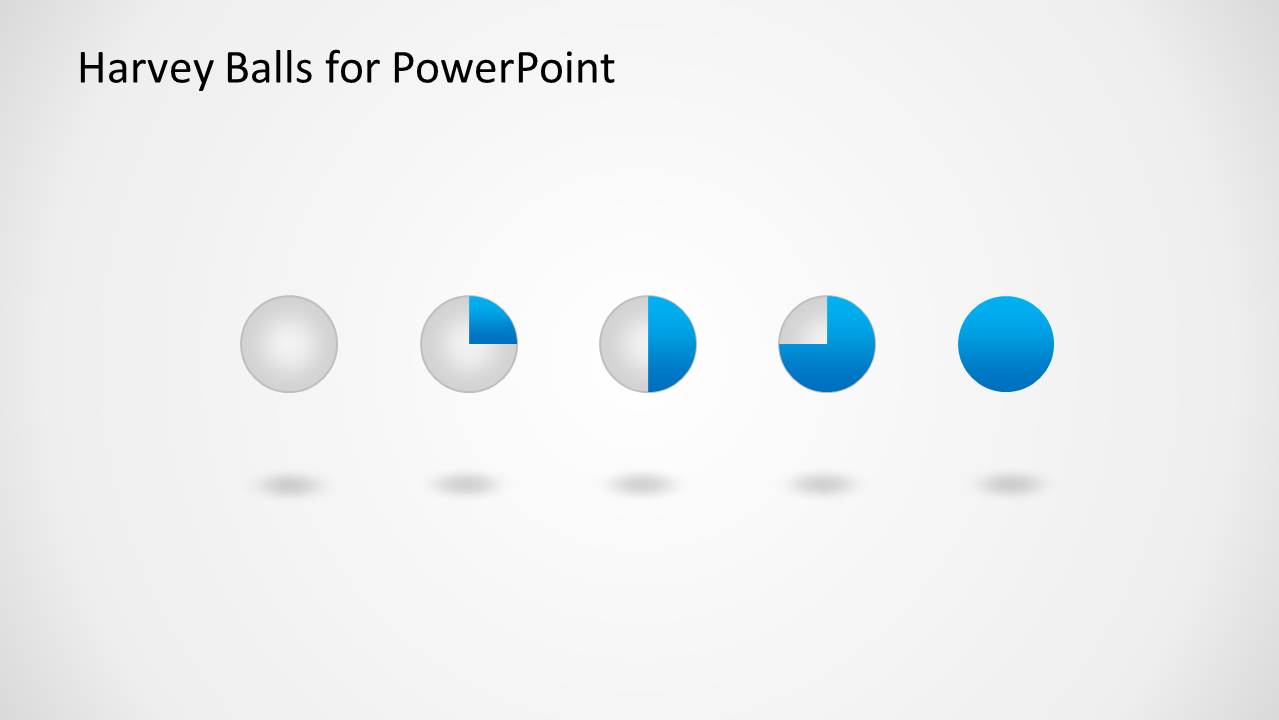
This template provides Harvey Balls for PowerPoint that you can copy and paste into your own presentations to visually present qualitative information.
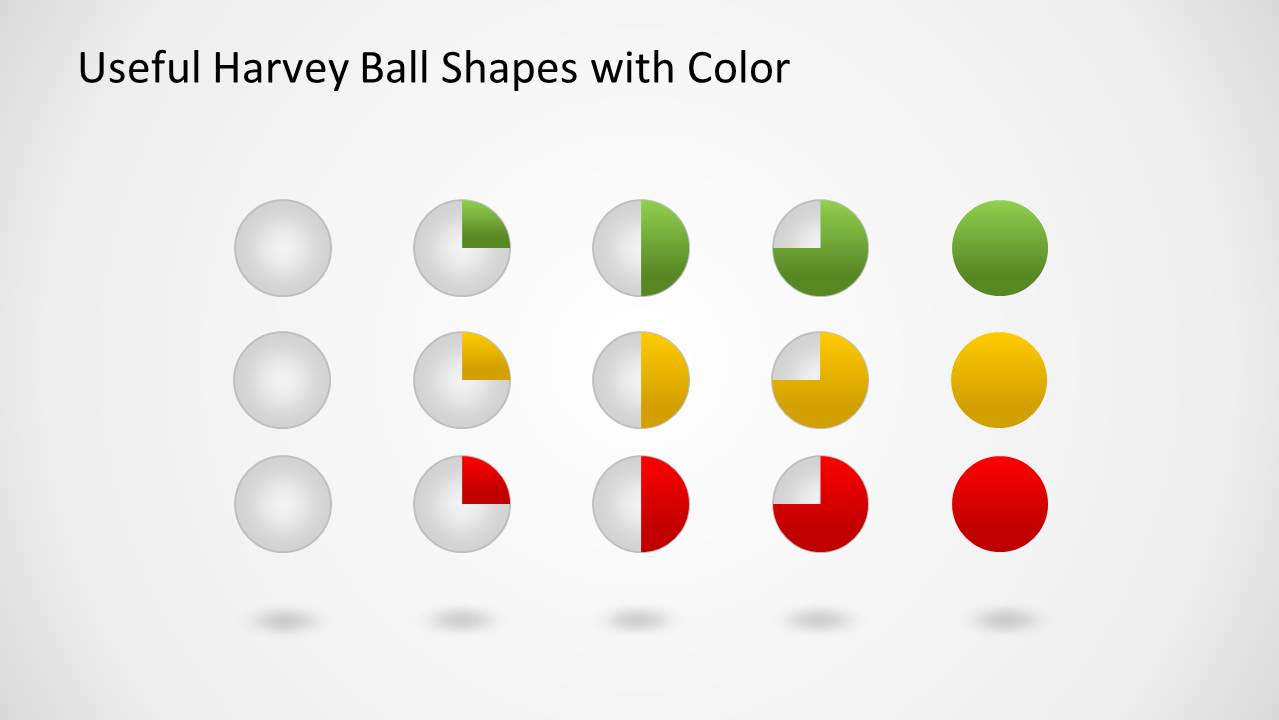
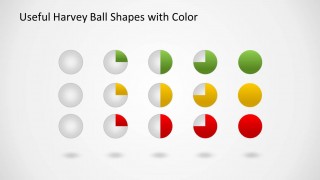
Different slides come with colorful Harvey Balls which can be conveniently used across existing slides and you can even make good use of the sample layouts to create relevant slides by adjusting the sample clipart and adding your own text.
Alternatively you can download other nice Harvey Balls PowerPoint templates and slide designs as well as other project management and PERT charts for PowerPoint.
What’s inside this template
Example presentation scenarios
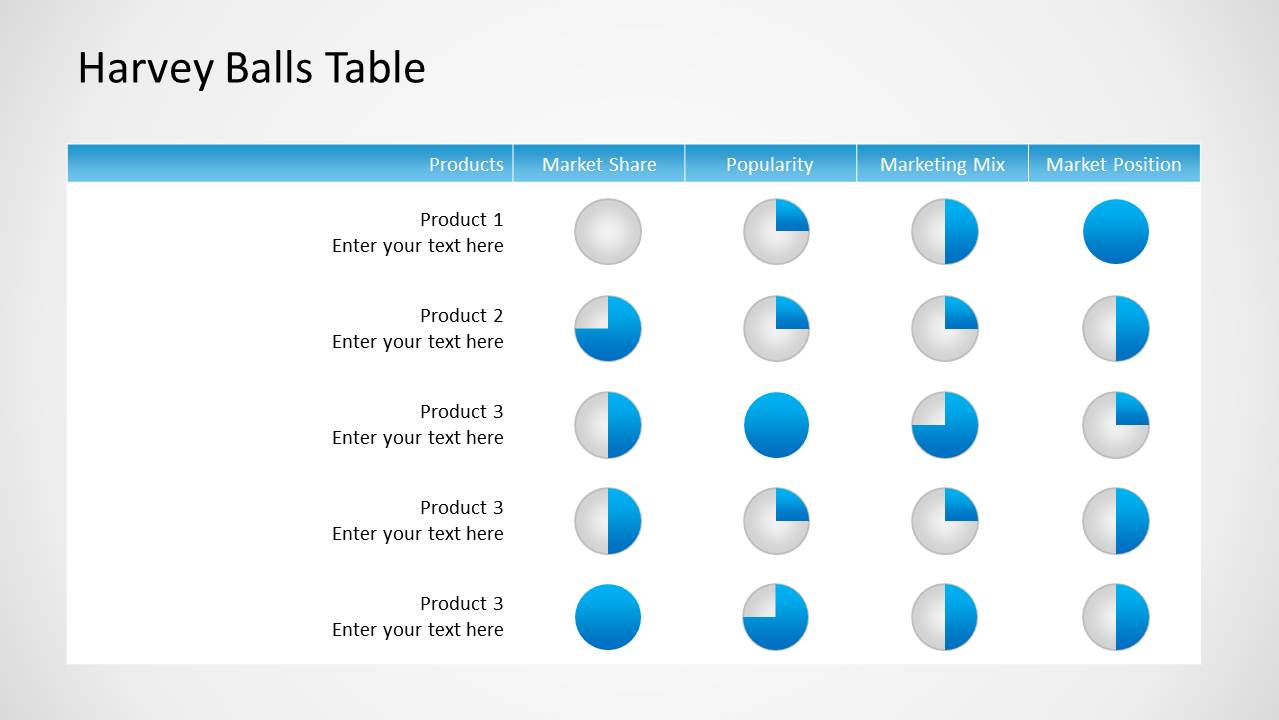
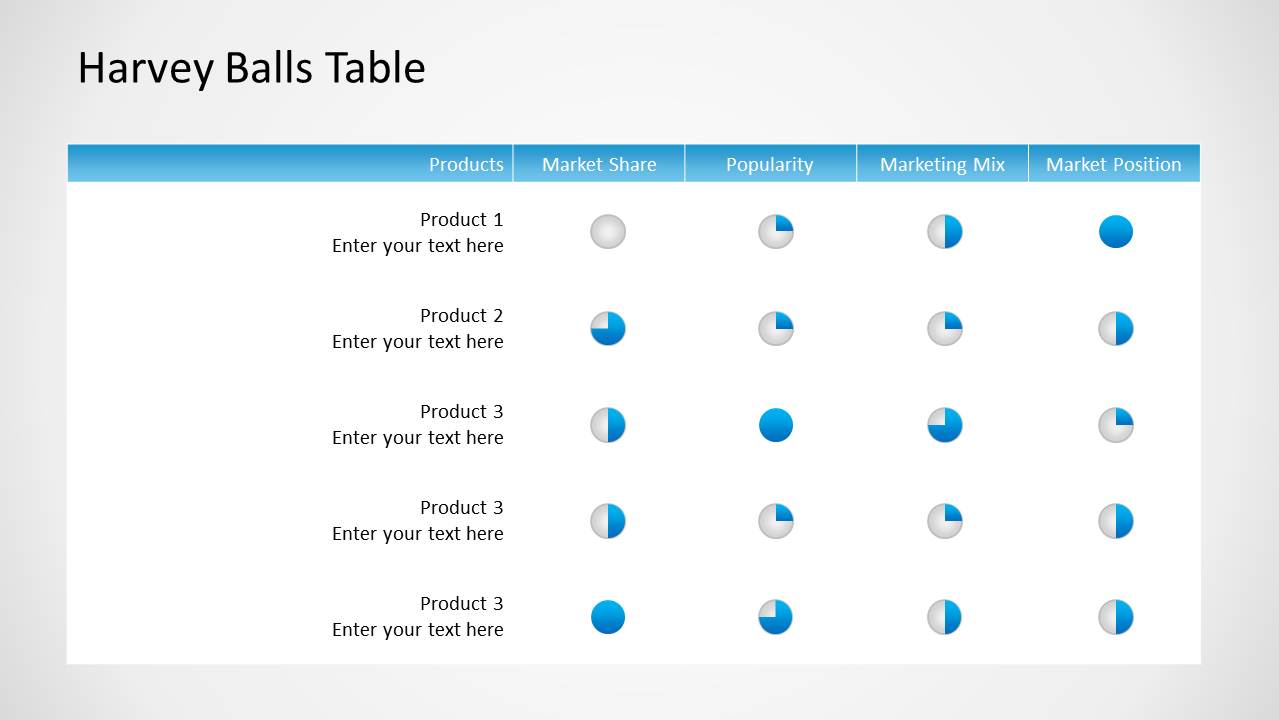
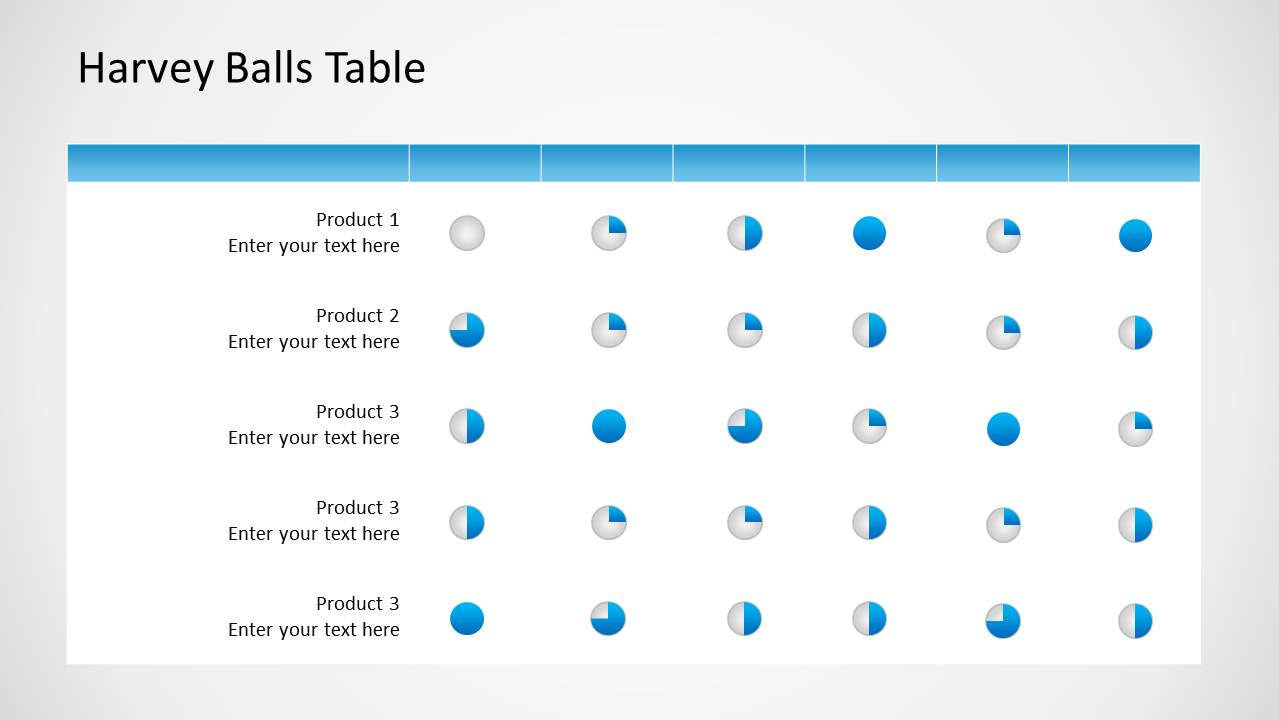
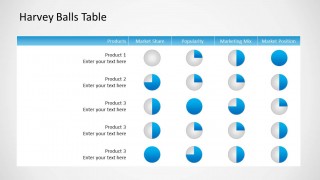
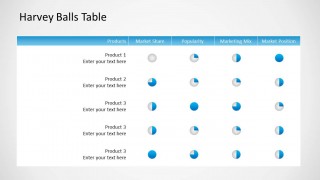
- A product manager can compare product lines by market share, popularity, marketing mix, and market position using the matrix table layouts.
- A consultant can summarize capability maturity for a client by replacing the sample product rows with business units and using the Harvey ball fill levels as ratings.
- A project lead can report status across workstreams by copying the editable Harvey ball icons into an existing governance deck.
- A marketing analyst can present competitive positioning with the blue table headers and color-coded Harvey ball palette for quick scanability.
Features
- 100% editable presentation template
- Compatible with Microsoft PowerPoint and Google Slides
- 16:9 aspect ratio slides
- Scalable vector shapes, icons and illustrations
- AI-Ready for Microsoft Copilot and Claude
- Instant access and download
Frequently asked questions
Q: How should I present Harvey ball ratings so the audience understands the scoring quickly?
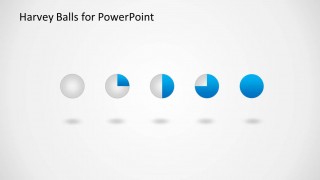
A: Start by defining the scale before showing the table, such as empty for low, half-filled for medium, and full for high. Then keep every row and column consistent. On the product comparison slides, use short metric labels and explain only the patterns that matter, not every individual symbol.
Q: Who is this template best suited for in a business presentation?
A: This template fits analysts, consultants, product managers, and project leaders who need to compare qualitative conditions across items. It works well for market position summaries, capability reviews, project health reports, and maturity assessments where the audience needs a fast visual read rather than exact numerical evidence.
Q: Why use Harvey balls instead of standard bar or pie charts?
A: Harvey balls work as a compact fill-level metaphor: the more complete the circle, the stronger the rating. That makes them useful inside tables where full charts would take too much space. The repeated symbols help viewers compare products and criteria quickly without shifting attention between different chart formats.
Harvey Ball Shapes for PowerPoint
6-slide presentation template with Harvey balls, rating scales, and product comparison tables
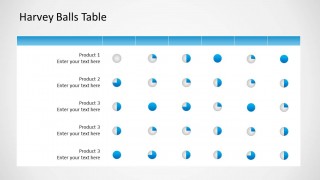
Harvey Ball Shapes for PowerPoint is a 6-slide presentation template for qualitative ratings and status visualization. It includes a title cover, single-row Harvey ball scale, product comparison matrix tables, and a multicolor Harvey ball palette. Business analysts, product managers, and project teams can edit the vector shapes in Microsoft PowerPoint and Google Slides.
- Category
- Data & Charts
- Rating


 Loading...
- Aspect ratio
- 16:9
- Item ID
- 1032
- Colors
 Microsoft PowerPoint
  Microsoft Copilot
  Claude for PowerPoint
 Other formats supported
Subscribe today and get immediate
access to download our PowerPoint templates.